.svg)

How DitchCarbon calculates Scope 3 emissions
Most Scope 3 calculations start with supplier surveys and spreadsheets. They're slow, patchy and hard to make auditable.
We work the other way round. We maintain a large dataset of company emissions disclosures, normalised to GHG Protocol categories. We match the organisations you buy from or invest in against that dataset, fall back to industry factors where a disclosure does not exist, and show you which is which. The result is numbers you can defend within 2 weeks, with every figure carrying its source and change history.
DitchCarbon provides verified emissions data for over 2 million organisations, so procurement, sustainability and finance teams can measure and act on supply chain and portfolio emissions from one source. This page documents how the calculation behind that data works.
We will walk you through the methodology on live data and your own emission factors, with time for questions.

No supplier surveys needed to get started

Verified to ISO 14064-3, limited assurance, by UL Solutions

Numbers you can defend within 2 weeks

Entity resolution against DUNS, LEI and ISIN identifiers

Every figure carries its source and change history
The calculation, step by step
We build your Scope 3 footprint through six connected steps. Each step adds coverage, accuracy or consistency, and each one is documented below.
We collect company emissions data from public disclosures and reports submitted to us directly. Our extraction engine normalises units to kgCO2e and maps disclosed categories to GHG Protocol categories, and our analysts review anything the validation rules flag.
Where company data is missing, industry averages are used. Ensures full coverage across all suppliers.
We calculate emissions from spend, sector and activity, using an organisation's own disclosures where they exist and revenue-based factors where they do not.

We collect company emissions data from public disclosures and reports submitted to us directly. Our extraction engine normalises units to kgCO2e and maps disclosed categories to GHG Protocol categories, and our analysts review anything the validation rules flag.
We map organisations into parent and subsidiary relationships, then assign emissions to the correct legal entity. Data cascades down a corporate tree from parent to subsidiary, never upwards.
Where an organisation has not disclosed, we apply an industry average factor for its industry, region and year. Every result is labelled with the method behind it, so coverage gaps are shown, not hidden.
We match your records to a single company profile using DUNS, LEI, ISIN and other identifiers you hold. Duplicates and naming differences resolve to the same entity, so one organisation is counted once.
We calculate emissions from spend, sector and activity, using an organisation's own disclosures where they exist and revenue-based factors where they do not.
Every record carries its source document, a mirror copy on our servers, version history and the QA checks it passed. Estimates are replaced as better disclosures arrive.
The full methodology
Everything below is versioned and maintained as standards, data sources and coverage change. Every change is documented so earlier calculations stay reproducible.
Methodology version 2026.2. Last updated 28 July 2026.
How organisations are identified, matched and structured
How emissions are calculated from company disclosures and industry factors
How organisations are scored and compared with their industry peers
How emissions are estimated where an organisation has not disclosed
How future emissions are projected from targets and scenarios
Organization Data
DitchCarbon aggregates disclosed emissions data, reduction targets and initiative participation for over 2 million organisations, and generates insights from that data with no surveys required.
An organisation record is the complete picture of one entity's climate position. Use it to:
- Pull primary data into Scope 3 calculations
- Forecast future emissions
- Segment and benchmark organisations
- Identify the highest leverage reduction actions with your counterparties
Access and export the data in the DitchCarbon web app, or through the API from the system you already run.
Organisation record payload
Data is aggregated into a standard structure, normalised for units and for the different ways organisations report, and mapped to GHG Protocol boundaries.
What an organisation record contains
Entity resolution: how your records match ours
You can send any combination of these inputs. Company identifiers are the fastest route to a confident match, so send them where you hold them.
A direct match identifier resolves straight to the corresponding entity in our system. Without one, we attempt a fuzzy match against our database.
How data cascades down corporate trees
We map your inputs to corporate legal entity trees, so coverage follows the real lines of corporate control.
A request may resolve to a subsidiary. If that subsidiary has disclosed emissions, set reduction targets, or joined an initiative we track, those data points appear in its record. If it has not, but a parent in its corporate tree has, the parent's data cascades down to the subsidiary. Data never cascades upwards.
Every request shows the requested organisation's legal name, the parent's legal name, and the relationship between them, for example L2 parent or ultimate parent, so the match is auditable.
Example:
If a user requests Beats Electronics, the subsidiary Organization (Beats Electronics, LLC) does not have emissions data, targets, or initiative participation, but its parent (Apple, Inc). Does Apple Inc's Scope 1-3 upstream emission factor, targets, and initiative participation cascade to the Beats request, and the "ultimate parent" relationship between the two entities is displayed.
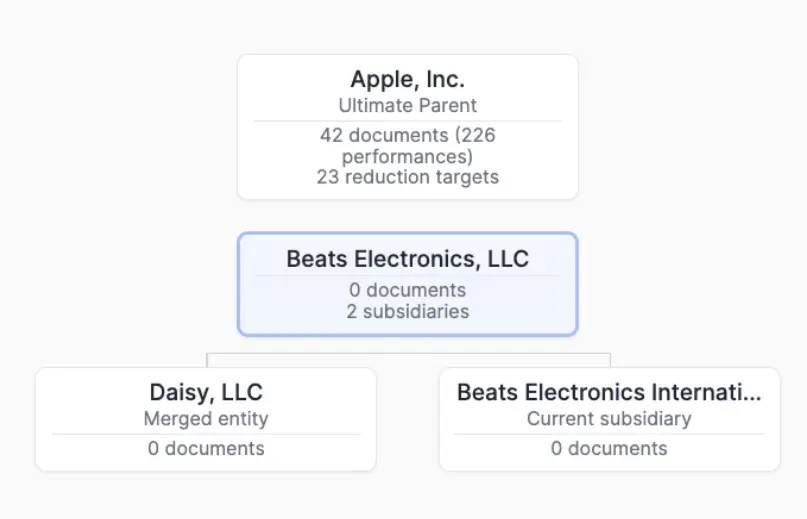
See example request, with subsidiary and parent Organization relationship type displayed:

Data ingestion
Our extraction engine and our analysts handle the problems anyone working with primary emissions data runs into:
- Gross and net emissions disclosures kept in separate fields
- Reported units normalised to kgCO2e
- Disclosed categories mapped to GHG Protocol categories, with unusable data points flagged
- Analyst review of every validation warning raised by anomalous data
Portability
All data exports in structured format as xls or csv.
Every export carries the original source url and a mirror url of the document as saved on our servers, so your audit trail survives a reporting organisation moving or removing its report.

Organisation-specific spend-based emission factors
We generate up to three organisation-level emission factors per organisation per year, from that organisation's disclosed global consolidated revenue and its disclosed global emissions.
A factor is only generated when every minimum data requirement is met. Where they are not met, the field is left blank rather than estimated.
Factors are expressed in kgCO2e per USD.
How do activity-based calculations work?
An activity-based calculation starts from a physical quantity rather than an amount spent: tonnes of a material, kilowatt hours of energy. The quantity is multiplied by an emission factor for that activity, expressed per physical unit rather than per unit of currency. It is a third methodology tier alongside the two documented above: organisation-specific spend-based factors and industry averages. Under the GHG Protocol's Category 1 calculation methods this is the average-data method, and under PCAF it is data quality score 3, ahead of the economic proxies at DQ 4 and DQ 5.
Activity emission factors come from ecoinvent, using cradle-to-gate impact scores calculated with IPCC 2021 GWP100 and excluding biogenic CO2, in line with the GHG Protocol. Biogenic CO2 is held separately, never netted into the factor. Ecoinvent's licensing terms apply: factor values and dataset detail are available to teams whose organisation holds its own ecoinvent licence, which we verify with ecoinvent, and computed results are available either way.
Quantities match to the right activity the way organisations match to records. An ecoinvent activity ID resolves directly. An exact activity or product name resolves deterministically, disambiguated by unit and geography where one name covers several datasets. Free text falls back to a scored fuzzy match, with candidates shown for review rather than silently picked. Units are normalised to the dataset's reference unit, and geography resolves from country to ecoinvent region to global, with both your input and the resolved geography stored.
Activity data works without spend, so you can start from quantities alone. Every calculation is pinned to the ecoinvent version it was computed with and keeps the dataset identifiers, the factor value, the unit conversion and the resolved geography, so a third-party auditor can reproduce the number and a database update never silently moves a historical result. Where your data mixes methods across organisations, products and activities, the audit export shows one summary per organisation and, behind it, every factor used and its source.
How do product-level calculations work?
A product-level calculation uses a product carbon footprint (PCF): the emissions of one unit of a specific product, supplied by the organisation that makes it. The quantity you purchased is multiplied by the PCF to give the emissions for that purchase. Under the GHG Protocol's Category 1 calculation methods this is the supplier-specific method, the most specific data tier there is, so where a credible PCF exists for what you bought it is preferred over activity factors, organisation-specific spend-based factors and industry averages.
PCFs reach the platform from the organisations you buy from, submitted directly or uploaded by you. Before a PCF is used it runs through our PCF evaluation, documented in the scoring and benchmarks section below, which checks completeness, flags values outside the expected range for the product category, and maps the data to the PACT schema so it can be shared and reused.
Quantities can be allocated to a PCF without spend, the same way activity data works, so product-level data is usable from day one. And as with every other method, the calculation keeps its evidence: each PCF carries its original source url and a mirror url from the copy saved on our servers, so the audit trail holds if the document moves, and every result is labelled as product-level, so you can see which purchases rest on supplier product data and which still rest on estimates.
How we decide which Scope 3 categories are relevant to an industry
Every organisation record has a primary industry, and every disclosure is checked against the relevance criteria for that industry.
For 16 heavy emitting industries we use CDP's Scope 3 technical note on relevance by sector. For industries CDP does not cover, we apply CDP's own meta-analysis method to significant samples of Scope 3 category detail disclosed by listed companies in our database, using reports disclosed in 2022 or later.
Revenue data: sourcing and traceability
Over 99% of revenue data comes from a tier-one global financial data provider, sourced from financial disclosures and converted to USD.
For the remaining share, under 1%, we may take revenue disclosed directly on a large or listed organisation's own website.
In every case we retain the original source url and provide it to you for audit purposes.
How our methods map to PCAF data-quality scores
- Reported & verified disclosures → DQ1
- Reported, unverified disclosures → DQ2
- Primary activity data → DQ3
- Economic model (S&P revenue × sector factors) → DQ4
Emissions data: sourcing and traceability
Emissions data is extracted from documents that organisations disclose. Those may be annual reports published online as PDFs or other formats, data published in html on an organisation's own website, or reports submitted to us directly.
We retain the original source and save a copy of each document on our servers. You receive the original source url and a mirror url from our copy, so your audit trail holds even if a reporting organisation moves its report.
We extract the reporting entity's legal name from the document and match it to the DitchCarbon organisation with the same legal entity name.
How extracted emissions data is structured
Gross CO2e data points are extracted from documents and mapped to the emissions boundaries of the GHG Protocol:
- Scope 1, with subcategories such as mobile combustion
- Scope 2 market-based, location-based and unspecified total, with subcategories such as purchased heat
- Scope 1 and 2 combined, where disclosed together
- All 15 Scope 3 categories
Our libraries translate every extracted data point into kgCO2e and map it to a standard GHG Protocol boundary.
Data points are merged into yearly performance records for each organisation. Because organisations restate, a data point from a more recently disclosed document overwrites the same year from an older one. If an organisation has a 2024 annual report covering 2022 to 2024 and a 2023 report covering 2021 to 2023, the 2022 and 2023 figures from the 2024 report win.
See the data dictionary for field-level detail
Entity resolution, second instance
Entity resolution works the same way here as in the organisation data section above: name is required, direct match identifiers resolve immediately, and without one we attempt a scored fuzzy match. Low confidence requests move to "waiting" status so you can add inputs.
How emission factors cascade down corporate trees
A resolved request matches to the requested organisation's record. If that organisation has its own emission factor, you get it. If it has not disclosed enough to generate a Scope 1 to 3 upstream factor but a parent entity has, the parent's factor cascades down. Factors never cascade upwards.
Every request shows the requested organisation's legal name, the matching organisation's legal name, and the relationship between them, for example L2 parent, so the number is auditable.
Example: a request for Beats Electronics resolves to Beats Electronics, LLC, which has no emissions or revenue data. Its ultimate parent, Apple Inc, does. Apple's Scope 1 to 3 upstream emission factor is used in the calculation, and the "ultimate parent" relationship is displayed.
See example export file with cascaded Matching Organizations:
Data and quality assurance
DitchCarbon aggregates emissions data, it does not generate it. Our job is to represent disclosed documents accurately and give you what you need to judge them.For every document we extract the assurance position for Scopes 1, 2 and 3:
- Assurance level received: limited, reasonable, unspecified or none
- The third-party assurer named
- The assurance statement text
- Any additional assurance url provided
Every document runs through an 18 step capture process, with each state logged. Extraction is machine or human depending on the document, and a set of validation rules routes possible failures to analyst review.
Those validations also catch mistakes made by the disclosing organisation, incorrectly reported units being the common one. We flag those to you and to the reporting organisation.
Overview
DitchCarbon scoring and benchmarking layers enable users to efficiently evaluate and compare the maturity of organizations and PCFs gathered from many sources.
DitchCarbon Score methodology
The DitchCarbon Score tells a procurement, sustainability or finance reader whether an organisation is acting on its emissions, and how it compares with its industry peers, without needing to read a sustainability report.
Every data point behind the score is in the organisation API response. Use the score as it comes, or use the same data and method to build your own.
The score analyses dozens of data points for an organisation and returns a number between 0 and 100. We publish the factor categories and their relative weights, because a score nobody can inspect does not change any decisions.
On the roadmap for the score
- Further initiatives: Race to Zero, Climate Action 100+, RE100 and EcoVadis, where publicly disclosed
- CDP score
- A comprehensiveness assessment of published net zero and near-term targets
Is a score good or bad? Use the peer benchmarks
A score only means something against a comparison, so we provide two:
- Industry mean score: the global average for organisations in the same industry
- Percentile benchmark: where a score ranks against its industry average
How are submitted PCFs evaluated?
The PCF evaluator gives a submitted product carbon footprint a general quality check before it is used or shared, and aligns it to the PACT standard. It is not a validation, verification or assurance service. It evaluates the data provided, names the quality issues worth weighing before you rely on the number, and flags PCFs that fall outside the expected emissions range for their product category.
An evaluation runs in four steps.
1. Field extraction. Submit a PCF by url or upload. The document is checked for around 50 expected fields, which are extracted and mapped to the PACT schema.
2. Data quality tier. The evaluator assigns low (boundaries, data sources and reporting standard unclear), medium (boundaries, data source and reporting standard specified) or high (carries an independent third-party product-level assurance statement). This tier is the evaluator's own scale for a single PCF, separate from the PCAF DQ scores documented in the emissions calculation section above.
3. Emissions range check. The product is matched to a NAICS category and benchmarked against the EPA Supply Chain GHG Emission Factors, which cover over 1,000 product and industry categories. The submitted price is inflation-adjusted to a common price year, and the expected range is plus or minus 200% of the category baseline, a threshold derived from published studies of supply chain variation. Values outside it are flagged for review, which catches order-of-magnitude errors while allowing for legitimate differences between supply chains.
4. PACT alignment. The evaluator lists the required PACT fields, auto-populates the ones it can extract, and marks the fields you provided by hand. It does not verify user-provided values.
What It Does:
The PCF Evaluator tool is a three-part evaluation system designed to provide users with a general data quality check on submitted Product Carbon Footprints, and to enable easier PCF sharing in alignment with the PACT standard.
The tool is not a validation, verification, or assurance service, but rather a test that evaluates data provided, identifies potential quality issues users may consider before using, and flags PCFs that fall outside expected emissions ranges for their product category.
Documentation below outlines the methodology, data sources, and logic that power the assessment.
Data Foundation: EPA NAICS Benchmarking
The tool uses the EPA Supply Chain GHG Emission Factors v1.3 by NAICS classification as its primary reference database. This database contains over 1,000 product and industry categories, each with associated emissions intensity factors (kg CO2e per USD, 2022 baseline).
When a user submits a PCF, the tool matches the product to its corresponding NAICS code. If no adequate match exists, the tool prompts the user to confirm the best code. NAICS-based benchmarking provides a standardized, government-backed foundation for reasonableness evaluation across diverse product categories.
Output: the report contains
- Data Quality Assessment: summarizes PCF data completeness & identifies gaps
- Emissions Range: shows where submitted PCF value falls within expected category range on a percentile basis, and flags if outside expected bounds
- PACT Alignment: Lists required PACT fields, auto-populated values, and user-provided fields requiring manual input
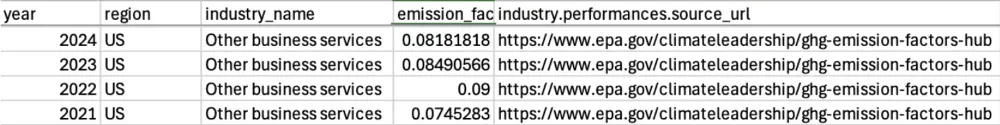
Industry average emission factors
We maintain a library of over 1,200 industries: roughly 200 top-level Exiobase sectors and around 1,000 more granular NAICS-based industries, across 43 countries and 5 global regions.
Every industry emission factor has an industry, a region and a year, in kgCO2e per USD, for example 2022 US steel or 2024 Egyptian business services. Because a factor resolves for each combination, the library holds many thousands of distinct factors.
Every input maps to an industry emission factor, so you always get a result, even from minimal information. Where something more specific exists, product data, activity-based factors, or an organisation's own spend-based factor, we use that instead and label which method produced each number. We calculate and store both the industry average and any organisation-specific factor, so you can switch methods without recalculating.
Independent verification
Two third parties have looked at this methodology independently, and they looked at different things.
UL Solutions verified the DitchCarbon Portal calculator, our managed content and our control environment to ISO 14064-3:2019 at limited assurance, using the GHG Protocol Corporate Value Chain (Scope 3) Standard and CDP guidance as criteria. The verification is renewed annually.
Globus Thenken independently assessed our industry emission factor computational methodology for spend-based Scope 3 Category 1 (purchased goods and services) and Category 2 (capital goods) in August 2025. They assessed it as compliant with the GHG Protocol Scope 3 Standard and ISO 14064-1:2018, and independently recalculated a 10% sample, with every deviation inside a 1% tolerance.
We are the only specialist Scope 3 tool with third-party assurance of its calculation methodology. Both reports are downloadable in full from our trust centre.
Sources and traceability
Industry factors are generated from EEIO data published by environmental researchers and government agencies: the US EPA, Exiobase, DenStore and UK DEFRA.
Which source applies depends on the organisation requested and on its industry and region inputs.
Where EPA supply-chain factors are used, both EPA v1.2 and v1.3 are available to toggle between for overlapping years, with v1.3 as the default.
Source urls are cited in every web app export and API response.
Industry emission factor selection
Selecting an industry factor needs both an industry name and a region.
You can send unstructured text for either. We map what you send to the right classification and use it. If you send neither, we fall back to the industry and region on our matching organisation record.
How an industry name maps to a DitchCarbon industry
- Matching runs against a curated library of over 10,000 confirmed name-to-industry matches, built from standard classification systems such as SIC and NAICS and reviewed by our team. Most inputs resolve directly against that reviewed library.
- For an input the library does not hold, an automated step proposes a candidate by working down our industry hierarchy from broad sector to sub-industry, with a confidence rating of high, medium or low. Our analysts confirm or override every new proposal.
- Each confirmed match goes back into the library, so the same input resolves the same way every time after that.
How a region maps to a DitchCarbon region
If the region you send is one of the 43 covered countries, we use that country's factor. Mexico, for example, has its own automotive manufacturing factor.
If it is not, we fall back to one of 5 global regions. Morocco, for example, resolves to World Africa.
Inflation and grid intensity adjustments
EEIO datasets update irregularly. Where a given year has no reported value, we adjust the closest historical year for inflation and grid intensity to produce that year's value. We only ever transform forward in time, never backwards.
Grid intensity
- Every database industry is assessed with IPCC 2013 GWP 100a V1.03, impact category IPCC GWP 100a
- The grid contribution to each industry's total footprint is calculated from the EU27 input-output database
- The grid portion of the factor is adjusted for changes in grid intensity over time, as reported by national grids
Inflation
- Adjusted using data from the US Bureau of Labor Statistics and the Bank of England
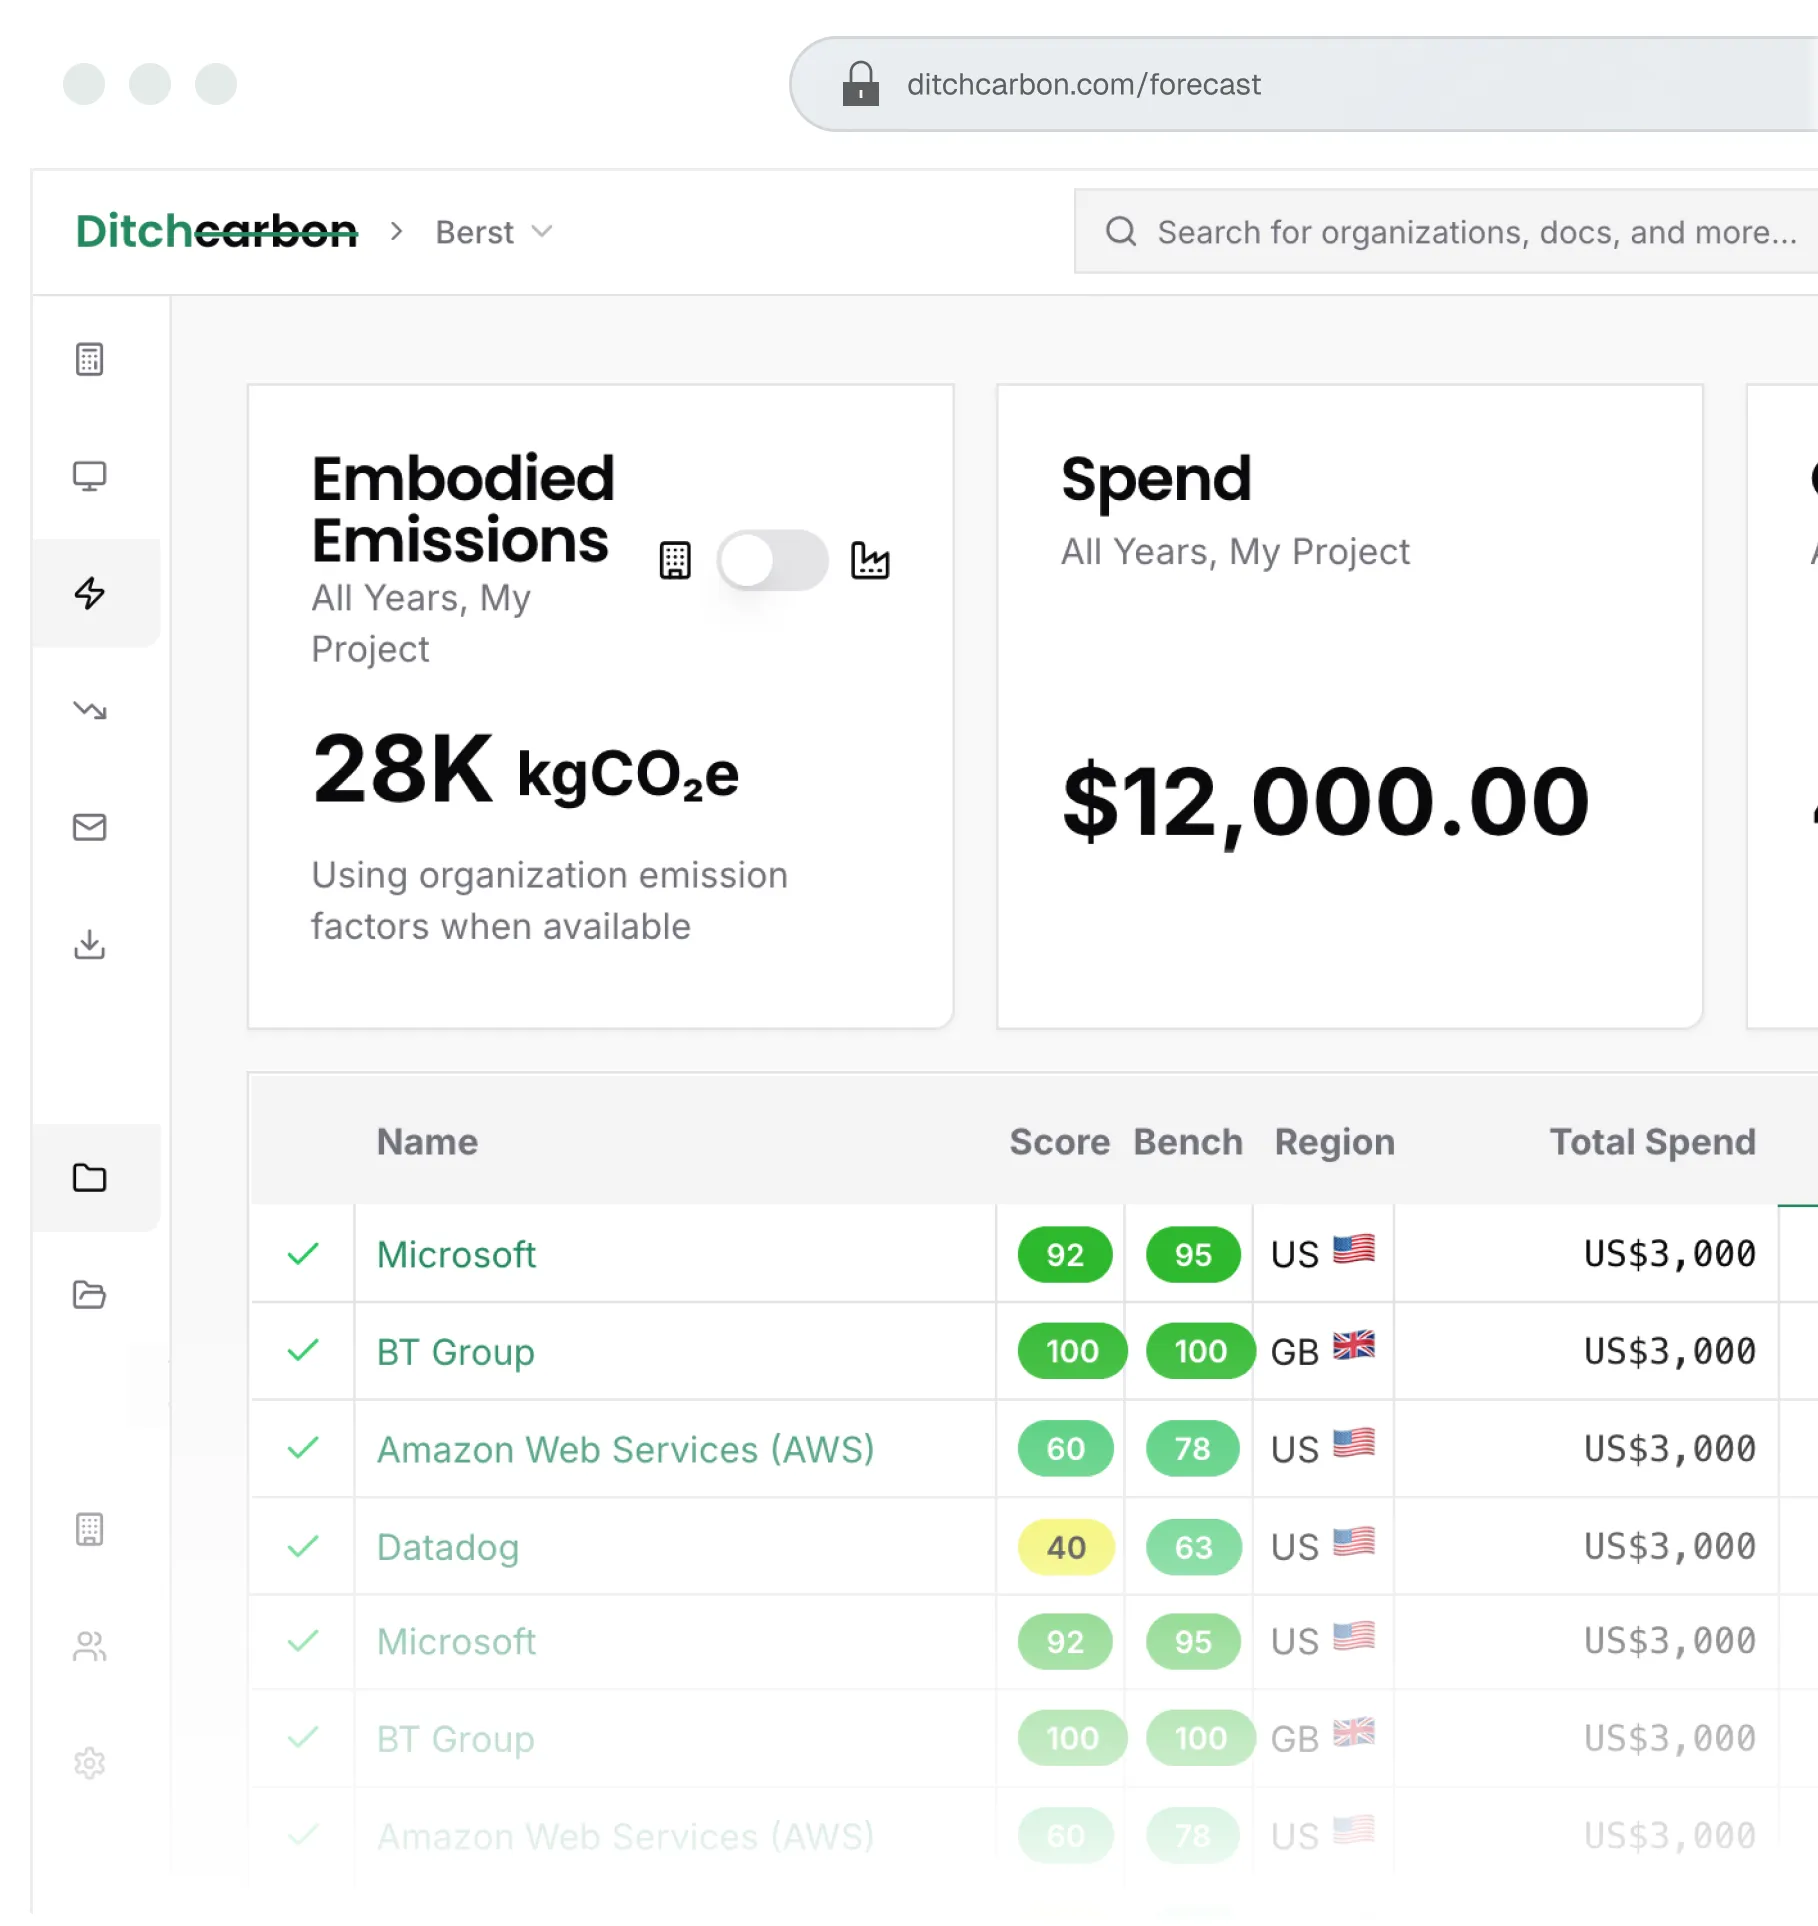
Forecasting module
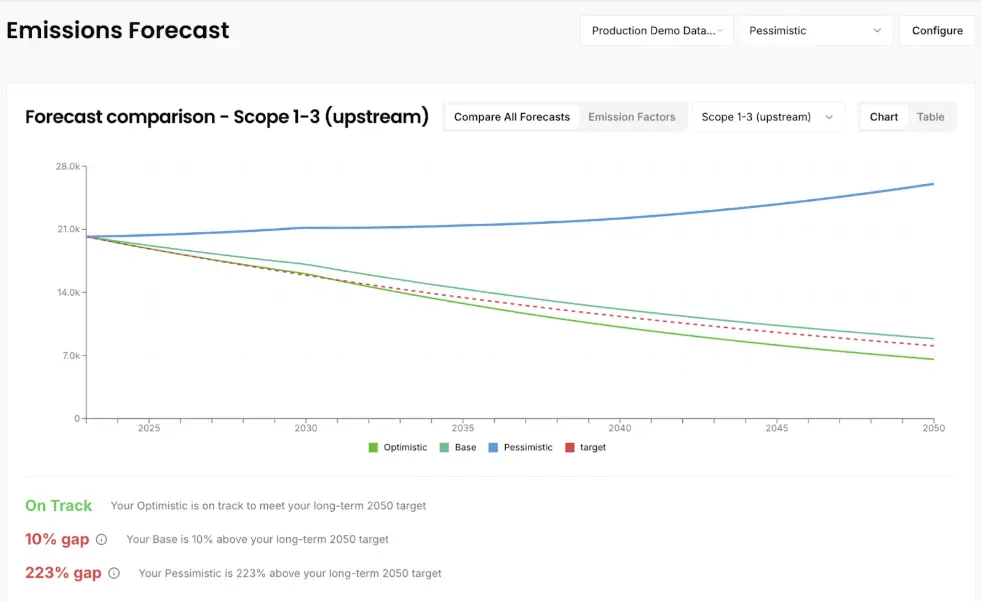
Forecast your annual embodied emissions out to 2050, based on the reduction targets the organisations in your supply chain or portfolio have set, or have not set, and how much of those targets you believe they will hit.
Configure several scenarios, plot them against your own Scope 3 targets, and see which organisations are driving any gap.
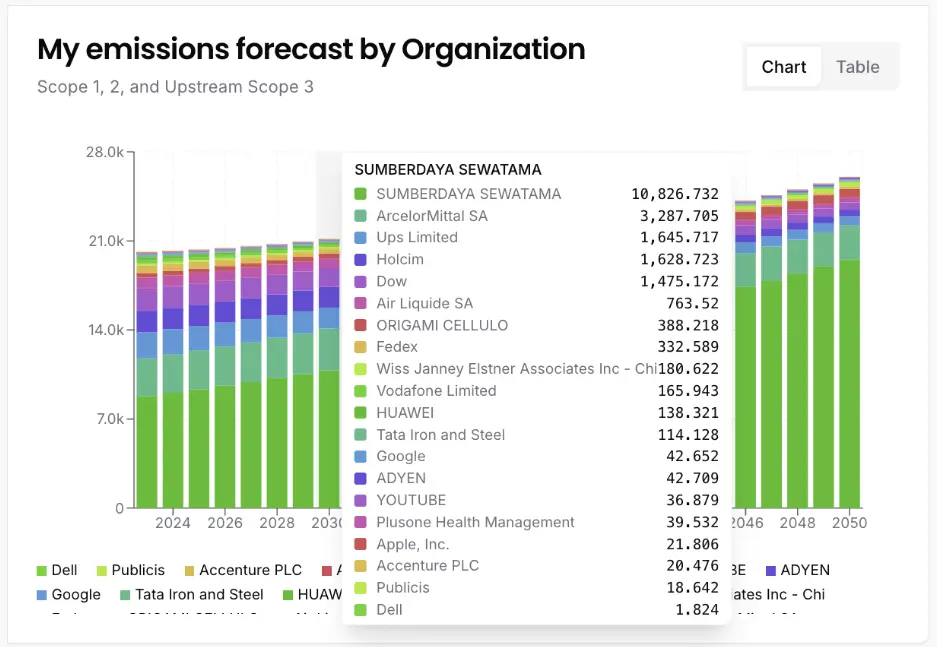
Forecasts are calculated at project level in the web app. Underneath each project forecast sit individual organisation forecasts, built from extracted reduction targets and your configuration.
Reduction target sources
Targets are structured as:
- Scope: Scope 1, Scope 2, Scope 3 upstream, Scope 3 all, or all scopes
- Type: absolute, intensity, net zero or climate neutral
- Start year and target year
- Reduction target
For each forecast year we select the applicable target by scope and apply it in priority order. SBTi validated targets rank highest, falling back to regional targets where your scenario allows it. We then calculate the target's implied cumulative annual average reduction rate and apply it to the relevant scopes for the relevant years.
Target cascading
If a requested organisation has set its own targets, we use those. If not, a parent's targets can cascade down to the subsidiary. Targets never cascade upwards.
Scenario configuration
Configure each scenario across four attributes.
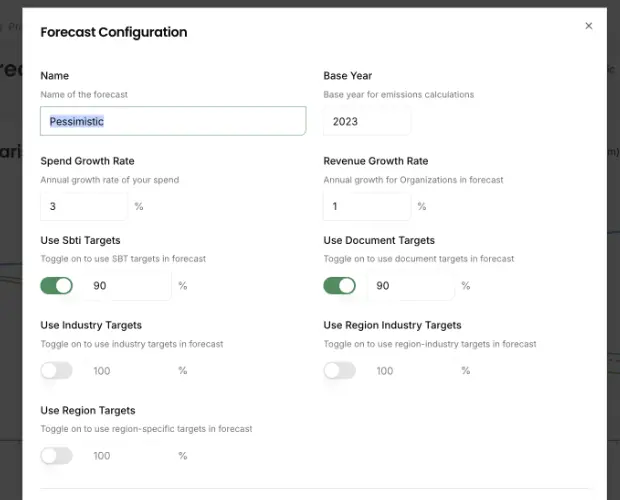
Targets to use:
- Give credit only for an organisation's own targets, or allow other targets as fallbacks where an organisation has set none.
Target attainment rate:
- Discount attainment by source type. If an organisation has committed to 20% on Scope 1 and 2 and 10% on Scope 3 by 2030, you can model it delivering 90% of that progress by the target date.
Spend growth rate:
- How fast your spend with these organisations is growing.
Revenue growth rate:
- How fast each organisation's own revenue is growing.
Fixed assumptions:
- Inflation is held at 2% a year for OECD headquartered organisations and 5% for non-OECD headquartered organisations.
Forecast calculation
Forecasts use the same factor logic as current-year calculations. An organisation-specific spend-based factor is used where the organisation has disclosed all Scope 3 categories relevant to its sector and revenue data is available. Factors cascade from parent to subsidiary where the subsidiary has not disclosed enough for its own. Where no organisation factor is available, we fall back to the industry average.With a factor selected, future embodied emissions are calculated as:
- Forecast future spend from your spend growth configuration
- Derive the average annual reduction rate implied by the applied target and attainment rate
- Forecast the future emission factor by applying the inflation assumption and that reduction rate
- Multiply the future factor by future spend
Where your configuration leaves an organisation with no applicable target, its embodied emissions grow with spend, revenue and inflation.
Portability
Structured target and forecast data exports as xls or csv, with original source urls and mirror urls, so your evidence survives a document moving after capture.

Frequently asked questions
The questions procurement, sustainability and finance teams ask most often.
See the methodology working on your own data
This page documents the calculation. A walkthrough shows it running against the organisations in your own supply chain or portfolio, with the source behind every figure.