.svg)

Emissions Reporting
Turn your emissions data into clear, actionable insights. DitchCarbon's emission reporting dashboard helps sustainability teams measure, understand, and reduce their carbon footprint with confidence.

Measure accurately across Scope 1–3

Identify emissions hotspots

Model decarbonisation scenarios

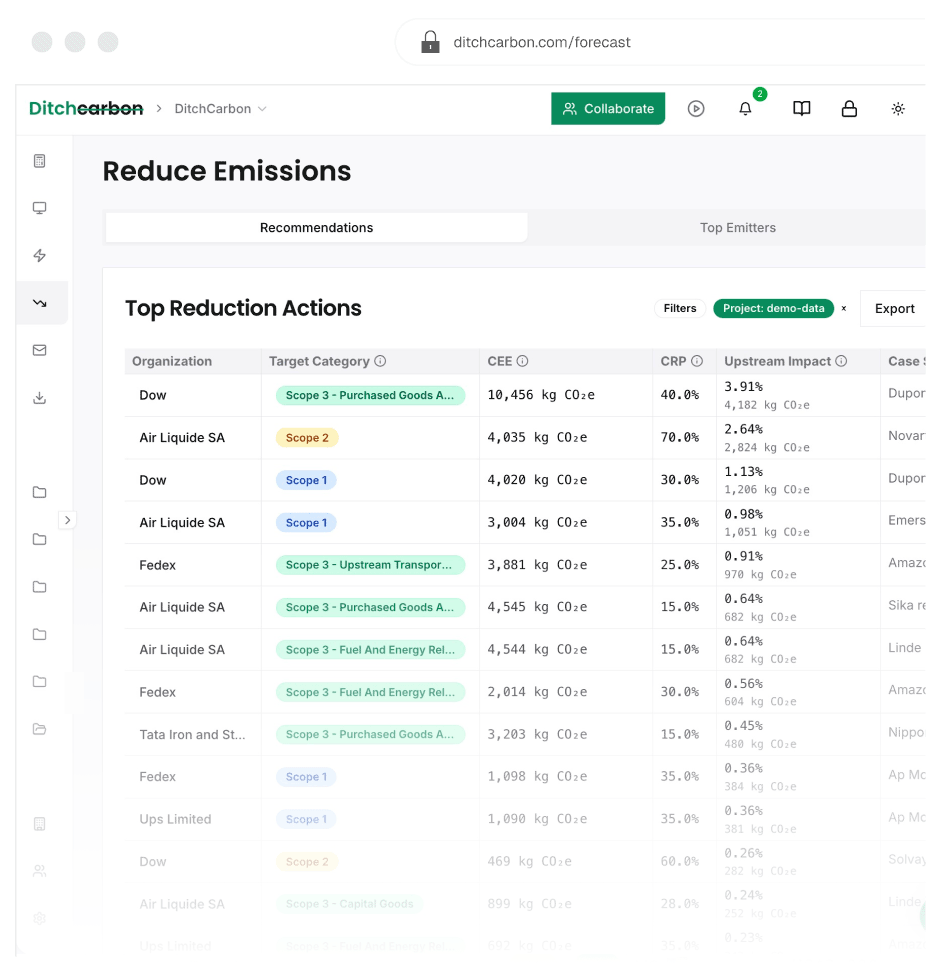
Prioritise the highest-impact actions

Communicate clearly to stakeholders
Explore this
use case
Measure and understand your full carbon footprint with confidence.
Understand emissions behind every dollar
Monitor Module. Track total emissions alongside total spend over time, measure carbon intensity ($ → kgCO₂e) to assess efficiency, benchmark against industry averages, and identify high-impact suppliers and categories.
This lets you move beyond totals and understand *why* emissions are changing.
See the future of your emissions
Forecast Module. The forecast view shows how your emissions could evolve under different scenarios, helping you move from reactive reporting to proactive strategy.
With scenario modelling, you can compare pathways like base, optimistic, and pessimistic outcomes, quantify the long-term impact of decisions today, identify when emissions reductions will slow down and require deeper action, and build credible roadmaps toward net zero.
Instead of guessing, you can clearly answer: what happens if we act now vs later?
Built for accurate, auditable reporting
Hybrid emission calculations
DitchCarbon combines multiple data sources to give you the most accurate emissions possible - supplier-specific emission factors when available, product-level data for higher precision, and industry averages to ensure full coverage. This hybrid approach ensures you always have complete data while continuously improving accuracy over time.
Category 1 and Category 2 coverage
Easily measure and report key Scope 3 categories. Category 1 (Purchased Goods & Services) tracks emissions tied directly to procurement and supplier spend. Category 2 (Capital Goods) captures emissions from long-term investments and infrastructure. Together they let you fully understand upstream impact and align with major reporting frameworks.
Seamless data import
Getting started is simple and flexible. Upload spend data via CSV or integrate directly with procurement systems, map suppliers, categories, and projects, and clean and standardise data within the platform. DitchCarbon ensures your data is structured correctly from day one, reducing manual work and errors.
Full audit trail and transparency
Every calculation is traceable. See exactly which emission factors were used, track data sources and updates over time, and maintain a clear audit trail for compliance and reporting. This gives you confidence when reporting to auditors, regulators, and stakeholders.
Export-ready reporting
Easily share your data and insights. Export emissions data and reports in multiple formats, support internal reporting and external disclosures, and simplify workflows for ESG reporting and compliance. No more manual consolidation - your reports are always ready.
From reporting to decision-making
DitchCarbon transforms emission reporting from a compliance exercise into a strategic advantage, giving sustainability managers the tools to make faster, smarter, and more impactful decisions.
Related articles


Frequently asked questions
Get answers to the questions procurement and sustainability teams ask most often.
You can start with basic spend data, and DitchCarbon will estimate emissions using industry factors - then improve accuracy over time by incorporating supplier-specific data.
DitchCarbon uses a hybrid approach, combining industry averages, product-level data, and supplier-specific emissions where available - ensuring both coverage and increasing accuracy over time.
Yes. The platform supports full Scope 1–3 reporting, with a strong focus on upstream Scope 3 emissions where most companies have the largest impact.
The forecast module models different scenarios based on your current data and potential reduction strategies, helping you understand how decisions today affect future emissions.
By identifying carbon hotspots and linking emissions to spend and suppliers, DitchCarbon helps you prioritise the highest-impact actions and track improvements over time.
Yes. The dashboard is designed to create clear, visual outputs that can be easily shared with executives, investors, and sustainability reporting frameworks.
Data can be updated as frequently as your internal systems allow, enabling continuous tracking and more accurate forecasting over time.
Join the industry leaders and solve your Scope 3 emissions data challenge
See how DitchCarbon can transform your sustainability journey with auditable insights and verified data.