data

Supplier and portfolio emissions data an auditor can follow

DitchCarbon provides verified emissions data for over 2 million organisations, built on primary emissions data wherever it exists, so procurement, sustainability and finance teams can measure and act on supply chain and portfolio emissions from one source.

See the data on a real company

Open any of these organisations to see what DitchCarbon holds: Scope 1, 2 and 3 emissions, climate targets and whether the organisation is on track against them, whether the report was assured by a third party, and which initiatives it has joined. This is the same record a procurement or finance team works from on their own list.

Accenture logoChanel logoFrieslandCampina logoBioNTech logoAB InBev logo
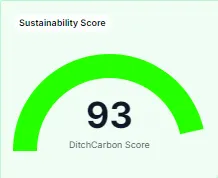
DitchCarbon platform card showing a Sustainability Score gauge with a DitchCarbon score of 93
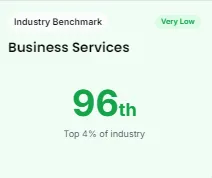
DitchCarbon platform card showing an Industry Benchmark for Business Services: 96th, top 4% of industry, rated Very Low
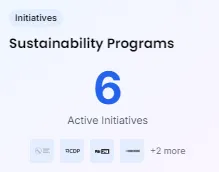
DitchCarbon platform card showing Sustainability Programs: 6 active initiatives
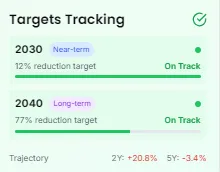
DitchCarbon platform card showing Targets Tracking: 2030 near-term 12% reduction target and 2040 long-term 77% reduction target, both on track
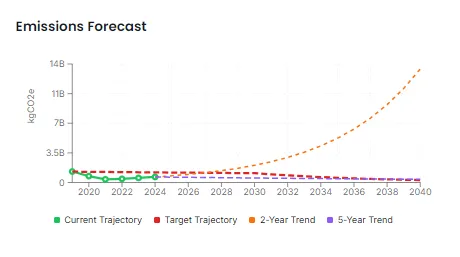
DitchCarbon platform Emissions Forecast chart from 2020 to 2040, comparing current trajectory, target trajectory, 2-year and 5-year trends
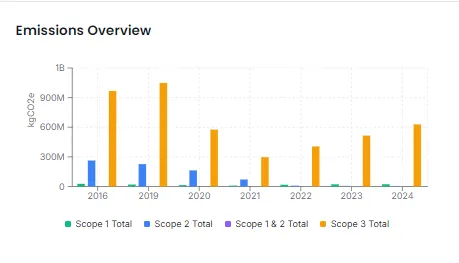
DitchCarbon platform Emissions Overview bar chart of Scope 1, Scope 2 and Scope 3 totals from 2016 to 2024, with Scope 3 largest
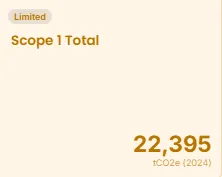
DitchCarbon platform card showing Scope 1 Total: 22,395 tCO2e (2024), marked Limited
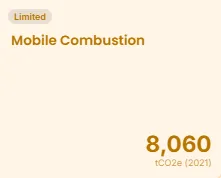
DitchCarbon platform card showing Mobile Combustion: 8,060 tCO2e (2021), marked Limited
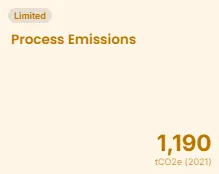
DitchCarbon platform card showing Process Emissions: 1,190 tCO2e (2021), marked Limited
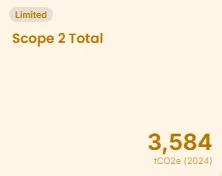
DitchCarbon platform card showing Scope 2 Total: 3,584 tCO2e (2024), marked Limited
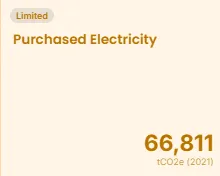
DitchCarbon platform card showing Purchased Electricity: 66,811 tCO2e (2021), marked Limited
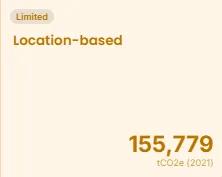
DitchCarbon platform card showing Location-based: 155,779 tCO2e (2021), marked Limited
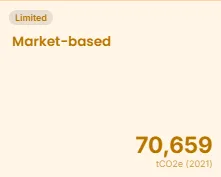
DitchCarbon platform card showing Market-based: 70,659 tCO2e (2021), marked Limited
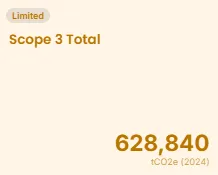
DitchCarbon platform card showing Scope 3 Total: 628,840 tCO2e (2024), marked Limited
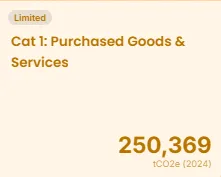
DitchCarbon platform card showing Cat 1: Purchased Goods & Services: 250,369 tCO2e (2024), marked Limited
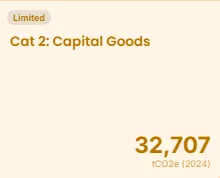
DitchCarbon platform card showing Cat 2: Capital Goods: 32,707 tCO2e (2024), marked Limited
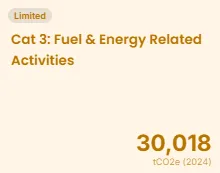
DitchCarbon platform card showing Cat 3: Fuel & Energy Related Activities: 30,018 tCO2e (2024), marked Limited
DitchCarbon platform card showing Cat 6: Business Travel: 240,963 tCO2e (2024), marked Limited
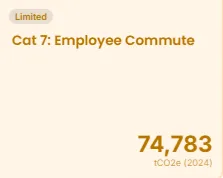
DitchCarbon platform card showing Cat 7: Employee Commute: 74,783 tCO2e (2024), marked Limited
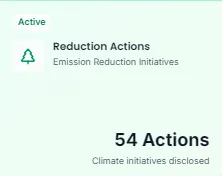
DitchCarbon platform card showing Reduction Actions: 54 actions, climate initiatives disclosed, marked Active
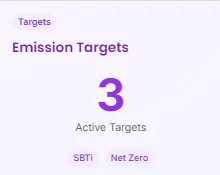
DitchCarbon platform card showing Emission Targets: 3 active targets, tagged SBTi and Net Zero
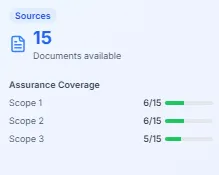
DitchCarbon platform card showing Sources: 15 documents available, with assurance coverage of 6/15 for Scope 1, 6/15 for Scope 2 and 5/15 for Scope 3
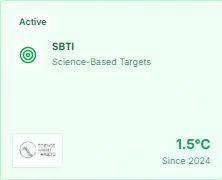
DitchCarbon platform card showing an active SBTi science-based target of 1.5°C since 2024
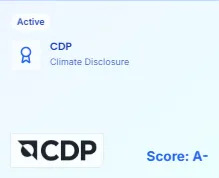
DitchCarbon platform card showing active CDP climate disclosure with a score of A-
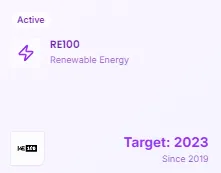
DitchCarbon platform card showing active RE100 renewable energy commitment, target 2023, since 2019
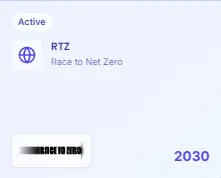
DitchCarbon platform card showing active Race to Zero commitment with a 2030 date
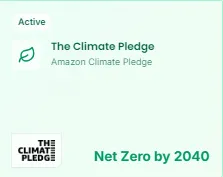
DitchCarbon platform card showing active membership of The Climate Pledge, net zero by 2040
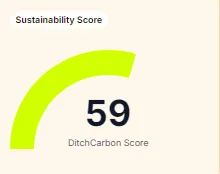
DitchCarbon platform card showing a Sustainability Score gauge with a DitchCarbon score of 59
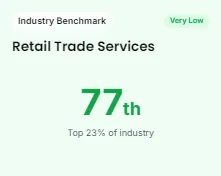
DitchCarbon platform card showing an Industry Benchmark for Retail Trade Services: 77th, top 23% of industry, rated Very Low
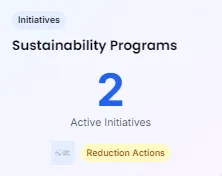
DitchCarbon platform card showing Sustainability Programs: 2 active initiatives, including Reduction Actions
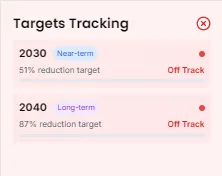
DitchCarbon platform card showing Targets Tracking: 2030 near-term 51% reduction target and 2040 long-term 87% reduction target, both off track
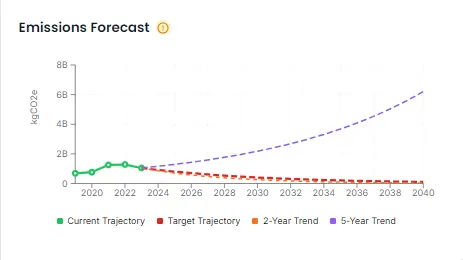
DitchCarbon platform Emissions Forecast chart from 2020 to 2040, comparing current trajectory, target trajectory, 2-year and 5-year trends
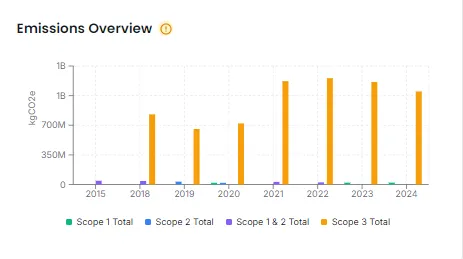
DitchCarbon platform Emissions Overview bar chart of Scope 1, Scope 2 and Scope 3 totals from 2015 to 2024, dominated by Scope 3
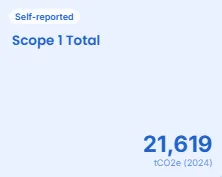
DitchCarbon platform card showing Scope 1 Total: 21,619 tCO2e (2024), marked Self-reported
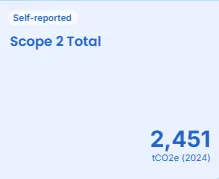
DitchCarbon platform card showing Scope 2 Total: 2,451 tCO2e (2024), marked Self-reported
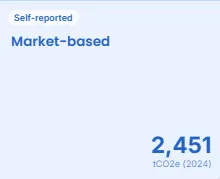
DitchCarbon platform card showing Market-based: 2,451 tCO2e (2024), marked Self-reported
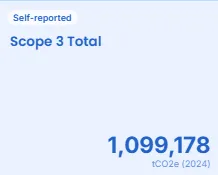
DitchCarbon platform card showing Scope 3 Total: 1,099,178 tCO2e (2024), marked Self-reported
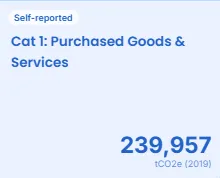
DitchCarbon platform card showing Cat 1: Purchased Goods & Services: 239,957 tCO2e (2019), marked Self-reported
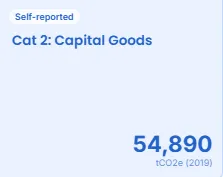
DitchCarbon platform card showing Cat 2: Capital Goods: 54,890 tCO2e (2019), marked Self-reported
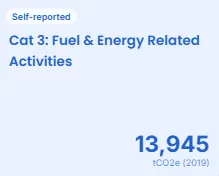
DitchCarbon platform card showing Cat 3: Fuel & Energy Related Activities: 13,945 tCO2e (2019), marked Self-reported
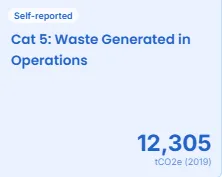
DitchCarbon platform card showing Cat 5: Waste Generated in Operations: 12,305 tCO2e (2019), marked Self-reported
DitchCarbon platform card showing Cat 6: Business Travel: 55,711 tCO2e (2019), marked Self-reported
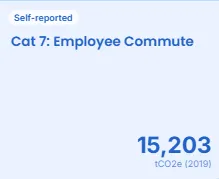
DitchCarbon platform card showing Cat 7: Employee Commute: 15,203 tCO2e (2019), marked Self-reported
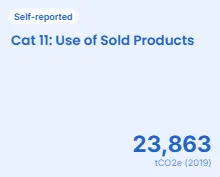
DitchCarbon platform card showing Cat 11: Use of Sold Products: 23,863 tCO2e (2019), marked Self-reported
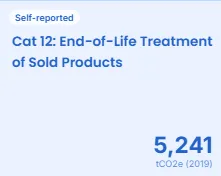
DitchCarbon platform card showing Cat 12: End-of-Life Treatment of Sold Products: 5,241 tCO2e (2019), marked Self-reported
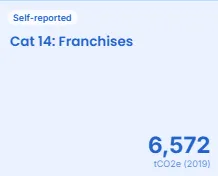
DitchCarbon platform card showing Cat 14: Franchises: 6,572 tCO2e (2019), marked Self-reported
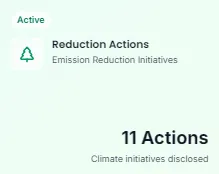
DitchCarbon platform card showing Reduction Actions: 11 actions, climate initiatives disclosed, marked Active
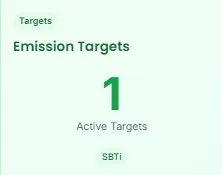
DitchCarbon platform card showing Emission Targets: 1 active target, tagged SBTi
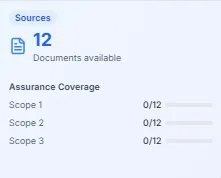
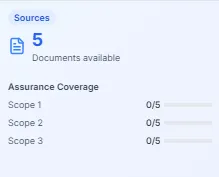
DitchCarbon platform card showing Sources: 12 documents available, with 0/12 assurance coverage for Scopes 1, 2 and 3
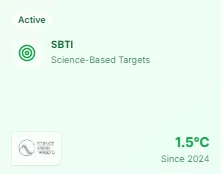
DitchCarbon platform card showing an active SBTi science-based target of 1.5°C since 2024
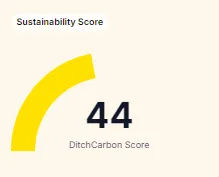
DitchCarbon platform card showing a Sustainability Score gauge with a DitchCarbon score of 44
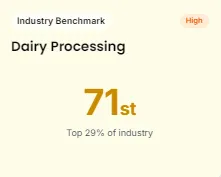
DitchCarbon platform card showing an Industry Benchmark for Dairy Processing: 71st, top 29% of industry, rated High
DitchCarbon platform card showing Sustainability Programs: 2 active initiatives, including Reduction Actions
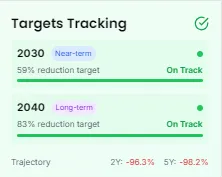
DitchCarbon platform card showing Targets Tracking: 2030 near-term 59% reduction target and 2040 long-term 83% reduction target, both on track
DitchCarbon platform Emissions Forecast chart from 2020 to 2040, comparing current trajectory, target trajectory, 2-year and 5-year trends
DitchCarbon platform Emissions Overview bar chart of Scope 1, Scope 2 and Scope 3 totals from 2015 to 2024, dominated by Scope 3
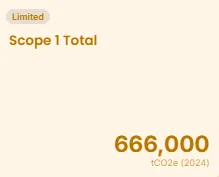
DitchCarbon platform card showing Scope 1 Total: 666,000 tCO2e (2024), marked Limited
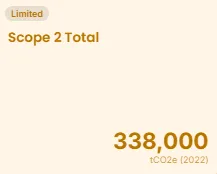
DitchCarbon platform card showing Scope 2 Total: 338,000 tCO2e (2022), marked Limited
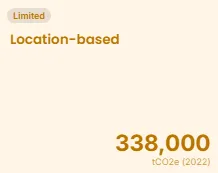
DitchCarbon platform card showing Location-based: 338,000 tCO2e (2022), marked Limited
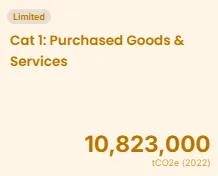
DitchCarbon platform screen showing a "Cat 1: Purchased Goods & Services" card, marked Limited, of 10,823,000 tCO2e (2022)
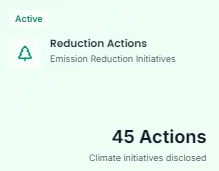
DitchCarbon platform screen showing an active "Reduction Actions" card with 45 climate initiatives disclosed
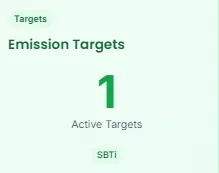
DitchCarbon platform screen showing an "Emission Targets" card with 1 active SBTi target
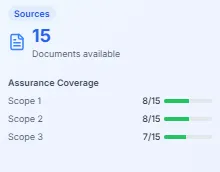
DitchCarbon platform screen showing a Sources card with 15 documents and assurance coverage of 8/15, 8/15 and 7/15 for Scopes 1 to 3
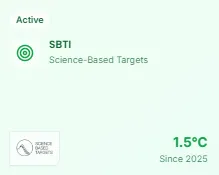
DitchCarbon platform screen showing an active SBTi Science-Based Targets card with a 1.5°C target since 2025
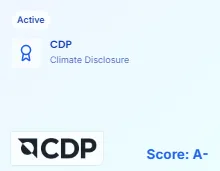
DitchCarbon platform screen showing an active CDP Climate Disclosure card with a score of A-
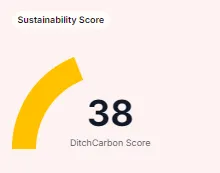
DitchCarbon platform screen showing a Sustainability Score gauge reading a DitchCarbon Score of 38
DitchCarbon platform card showing an Industry Benchmark for Retail Trade Services: 77th, top 23% of industry, rated Very Low
DitchCarbon platform card showing Sustainability Programs: 2 active initiatives, including Reduction Actions
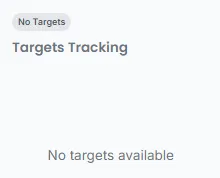
DitchCarbon platform screen showing a "Targets Tracking" card reading "No targets available"
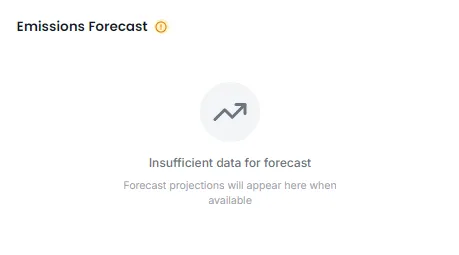
DitchCarbon platform screen showing an "Emissions Forecast" panel reading "Insufficient data for forecast"
DitchCarbon platform Emissions Overview bar chart of Scope 1, Scope 2 and Scope 3 totals from 2015 to 2024, dominated by Scope 3
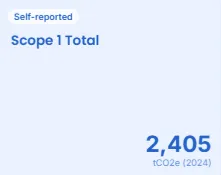
DitchCarbon platform screen showing a self-reported "Scope 1 Total" card of 2,405 tCO2e (2024)
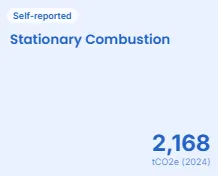
DitchCarbon platform screen showing a self-reported "Stationary Combustion" card of 2,168 tCO2e (2024)
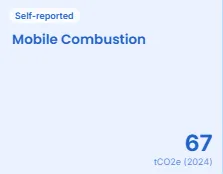
DitchCarbon platform screen showing a self-reported "Mobile Combustion" card of 67 tCO2e (2024)
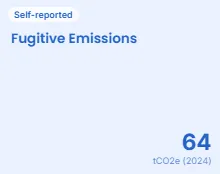
DitchCarbon platform screen showing a self-reported "Fugitive Emissions" card of 64 tCO2e (2024)
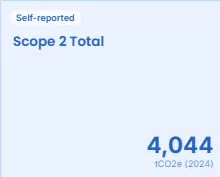
DitchCarbon platform screen showing a self-reported "Scope 2 Total" card of 4,044 tCO2e (2024)
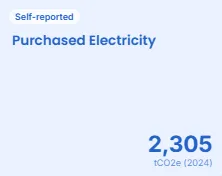
DitchCarbon platform screen showing a self-reported "Purchased Electricity" card of 2,305 tCO2e (2024)
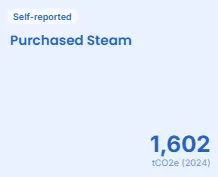
DitchCarbon platform screen showing a self-reported "Purchased Steam" card of 1,602 tCO2e (2024)
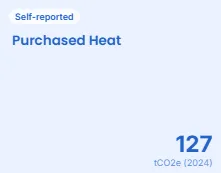
DitchCarbon platform screen showing a self-reported "Purchased Heat" card of 127 tCO2e (2024)
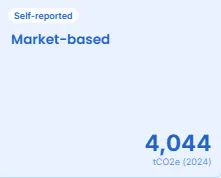
DitchCarbon platform screen showing a self-reported "Market-based" card of 4,044 tCO2e (2024)
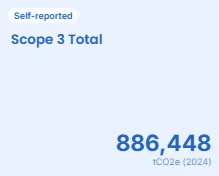
DitchCarbon platform screen showing a self-reported "Scope 3 Total" card of 886,448 tCO2e (2024)
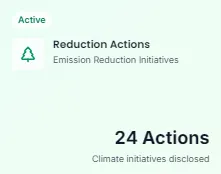
DitchCarbon platform screen showing an active "Reduction Actions" card with 24 climate initiatives disclosed
DitchCarbon platform card showing Emission Targets: 1 active target, tagged SBTi
DitchCarbon platform screen showing a Sources card with 5 documents and assurance coverage of 0/5 for Scopes 1 to 3
DitchCarbon platform card showing Emission Targets: 1 active target, tagged SBTi
DitchCarbon platform screen showing a Sustainability Score gauge reading a DitchCarbon Score of 38
DitchCarbon platform card showing an Industry Benchmark for Retail Trade Services: 77th, top 23% of industry, rated Very Low
DitchCarbon platform card showing Sustainability Programs: 2 active initiatives, including Reduction Actions
DitchCarbon platform screen showing a "Targets Tracking" card reading "No targets available"
DitchCarbon platform screen showing an "Emissions Forecast" panel reading "Insufficient data for forecast"
DitchCarbon platform Emissions Overview bar chart of Scope 1, Scope 2 and Scope 3 totals from 2015 to 2024, dominated by Scope 3
DitchCarbon platform screen showing a self-reported "Scope 1 Total" card of 2,405 tCO2e (2024)
DitchCarbon platform screen showing a self-reported "Stationary Combustion" card of 2,168 tCO2e (2024)
DitchCarbon platform screen showing a self-reported "Mobile Combustion" card of 67 tCO2e (2024)
DitchCarbon platform screen showing a self-reported "Fugitive Emissions" card of 64 tCO2e (2024)
DitchCarbon platform screen showing a self-reported "Scope 2 Total" card of 4,044 tCO2e (2024)
DitchCarbon platform screen showing a self-reported "Purchased Electricity" card of 2,305 tCO2e (2024)
DitchCarbon platform screen showing a self-reported "Purchased Steam" card of 1,602 tCO2e (2024)
DitchCarbon platform screen showing a self-reported "Purchased Heat" card of 127 tCO2e (2024)
DitchCarbon platform screen showing a self-reported "Market-based" card of 4,044 tCO2e (2024)
DitchCarbon platform screen showing a self-reported "Scope 3 Total" card of 886,448 tCO2e (2024)
DitchCarbon platform screen showing an active "Reduction Actions" card with 24 climate initiatives disclosed
DitchCarbon platform card showing Emission Targets: 1 active target, tagged SBTi
DitchCarbon platform screen showing a Sources card with 5 documents and assurance coverage of 0/5 for Scopes 1 to 3
DitchCarbon platform card showing Emission Targets: 1 active target, tagged SBTi

What data does DitchCarbon actually hold?

Three layers, and every figure on the platform comes from one of them.

Company emissions data for over 2 million organisations
including corporate-level GHG inventories, climate targets and SBTi status, with every figure carrying its source and change history.
Supplier-specific emissions at spend, activity and product level
calculated for a named organisation from what that organisation has disclosed.
A large library of published emission factors
drawn from ecoinvent, CEDA, EPA, DEFRA and EXIOBASE, so a full inventory closes even where nothing has been disclosed.

Each organisation records which of the four methods produced its figure, and industry data is fourth of four, used only where the first three could not be found. The share of your baseline still resting on a generic factor is a number you can filter for, not a claim you have to take on trust.

See the data on a real company

Open any of these organisations to see what DitchCarbon holds: Scope 1, 2 and 3 emissions, climate targets and whether the organisation is on track against them, whether the report was assured by a third party, and which initiatives it has joined. This is the same record a procurement or finance team works from on their own list.


Accenture logoChanel logoFrieslandCampina logoBioNTech logoAB InBev logo
DitchCarbon platform card showing a Sustainability Score gauge with a DitchCarbon score of 93
DitchCarbon platform card showing an Industry Benchmark for Business Services: 96th, top 4% of industry, rated Very Low
DitchCarbon platform card showing Sustainability Programs: 6 active initiatives
DitchCarbon platform card showing Targets Tracking: 2030 near-term 12% reduction target and 2040 long-term 77% reduction target, both on track
DitchCarbon platform Emissions Forecast chart from 2020 to 2040, comparing current trajectory, target trajectory, 2-year and 5-year trends
DitchCarbon platform Emissions Overview bar chart of Scope 1, Scope 2 and Scope 3 totals from 2016 to 2024, with Scope 3 largest
DitchCarbon platform card showing Scope 1 Total: 22,395 tCO2e (2024), marked Limited
DitchCarbon platform card showing Mobile Combustion: 8,060 tCO2e (2021), marked Limited
DitchCarbon platform card showing Process Emissions: 1,190 tCO2e (2021), marked Limited
DitchCarbon platform card showing Scope 2 Total: 3,584 tCO2e (2024), marked Limited
DitchCarbon platform card showing Purchased Electricity: 66,811 tCO2e (2021), marked Limited
DitchCarbon platform card showing Location-based: 155,779 tCO2e (2021), marked Limited
DitchCarbon platform card showing Market-based: 70,659 tCO2e (2021), marked Limited
DitchCarbon platform card showing Scope 3 Total: 628,840 tCO2e (2024), marked Limited
DitchCarbon platform card showing Cat 1: Purchased Goods & Services: 250,369 tCO2e (2024), marked Limited
DitchCarbon platform card showing Cat 2: Capital Goods: 32,707 tCO2e (2024), marked Limited
DitchCarbon platform card showing Cat 3: Fuel & Energy Related Activities: 30,018 tCO2e (2024), marked Limited
DitchCarbon platform card showing Cat 6: Business Travel: 240,963 tCO2e (2024), marked Limited
DitchCarbon platform card showing Cat 7: Employee Commute: 74,783 tCO2e (2024), marked Limited
DitchCarbon platform card showing Reduction Actions: 54 actions, climate initiatives disclosed, marked Active
DitchCarbon platform card showing Emission Targets: 3 active targets, tagged SBTi and Net Zero
DitchCarbon platform card showing Sources: 15 documents available, with assurance coverage of 6/15 for Scope 1, 6/15 for Scope 2 and 5/15 for Scope 3
DitchCarbon platform card showing an active SBTi science-based target of 1.5°C since 2024
DitchCarbon platform card showing active CDP climate disclosure with a score of A-
DitchCarbon platform card showing active RE100 renewable energy commitment, target 2023, since 2019
DitchCarbon platform card showing active Race to Zero commitment with a 2030 date
DitchCarbon platform card showing active membership of The Climate Pledge, net zero by 2040
DitchCarbon platform card showing a Sustainability Score gauge with a DitchCarbon score of 59
DitchCarbon platform card showing an Industry Benchmark for Retail Trade Services: 77th, top 23% of industry, rated Very Low
DitchCarbon platform card showing Sustainability Programs: 2 active initiatives, including Reduction Actions
DitchCarbon platform card showing Targets Tracking: 2030 near-term 51% reduction target and 2040 long-term 87% reduction target, both off track
DitchCarbon platform Emissions Forecast chart from 2020 to 2040, comparing current trajectory, target trajectory, 2-year and 5-year trends
DitchCarbon platform Emissions Overview bar chart of Scope 1, Scope 2 and Scope 3 totals from 2015 to 2024, dominated by Scope 3
DitchCarbon platform card showing Scope 1 Total: 21,619 tCO2e (2024), marked Self-reported
DitchCarbon platform card showing Scope 2 Total: 2,451 tCO2e (2024), marked Self-reported
DitchCarbon platform card showing Market-based: 2,451 tCO2e (2024), marked Self-reported
DitchCarbon platform card showing Scope 3 Total: 1,099,178 tCO2e (2024), marked Self-reported
DitchCarbon platform card showing Cat 1: Purchased Goods & Services: 239,957 tCO2e (2019), marked Self-reported
DitchCarbon platform card showing Cat 2: Capital Goods: 54,890 tCO2e (2019), marked Self-reported
DitchCarbon platform card showing Cat 3: Fuel & Energy Related Activities: 13,945 tCO2e (2019), marked Self-reported
DitchCarbon platform card showing Cat 5: Waste Generated in Operations: 12,305 tCO2e (2019), marked Self-reported
DitchCarbon platform card showing Cat 6: Business Travel: 55,711 tCO2e (2019), marked Self-reported
DitchCarbon platform card showing Cat 7: Employee Commute: 15,203 tCO2e (2019), marked Self-reported
DitchCarbon platform card showing Cat 11: Use of Sold Products: 23,863 tCO2e (2019), marked Self-reported
DitchCarbon platform card showing Cat 12: End-of-Life Treatment of Sold Products: 5,241 tCO2e (2019), marked Self-reported
DitchCarbon platform card showing Cat 14: Franchises: 6,572 tCO2e (2019), marked Self-reported
DitchCarbon platform card showing Reduction Actions: 11 actions, climate initiatives disclosed, marked Active
DitchCarbon platform card showing Emission Targets: 1 active target, tagged SBTi
DitchCarbon platform card showing Sources: 12 documents available, with 0/12 assurance coverage for Scopes 1, 2 and 3
DitchCarbon platform card showing an active SBTi science-based target of 1.5°C since 2024
DitchCarbon platform card showing a Sustainability Score gauge with a DitchCarbon score of 44
DitchCarbon platform card showing an Industry Benchmark for Dairy Processing: 71st, top 29% of industry, rated High
DitchCarbon platform card showing Sustainability Programs: 2 active initiatives, including Reduction Actions
DitchCarbon platform card showing Targets Tracking: 2030 near-term 59% reduction target and 2040 long-term 83% reduction target, both on track
DitchCarbon platform Emissions Forecast chart from 2020 to 2040, comparing current trajectory, target trajectory, 2-year and 5-year trends
DitchCarbon platform Emissions Overview bar chart of Scope 1, Scope 2 and Scope 3 totals from 2015 to 2024, dominated by Scope 3
DitchCarbon platform card showing Scope 1 Total: 666,000 tCO2e (2024), marked Limited
DitchCarbon platform card showing Scope 2 Total: 338,000 tCO2e (2022), marked Limited
DitchCarbon platform card showing Location-based: 338,000 tCO2e (2022), marked Limited
DitchCarbon platform screen showing a "Cat 1: Purchased Goods & Services" card, marked Limited, of 10,823,000 tCO2e (2022)
DitchCarbon platform screen showing an active "Reduction Actions" card with 45 climate initiatives disclosed
DitchCarbon platform screen showing an "Emission Targets" card with 1 active SBTi target
DitchCarbon platform screen showing a Sources card with 15 documents and assurance coverage of 8/15, 8/15 and 7/15 for Scopes 1 to 3
DitchCarbon platform screen showing an active SBTi Science-Based Targets card with a 1.5°C target since 2025
DitchCarbon platform screen showing an active CDP Climate Disclosure card with a score of A-
DitchCarbon platform screen showing a Sustainability Score gauge reading a DitchCarbon Score of 38
DitchCarbon platform card showing an Industry Benchmark for Retail Trade Services: 77th, top 23% of industry, rated Very Low
DitchCarbon platform card showing Sustainability Programs: 2 active initiatives, including Reduction Actions
DitchCarbon platform screen showing a "Targets Tracking" card reading "No targets available"
DitchCarbon platform screen showing an "Emissions Forecast" panel reading "Insufficient data for forecast"
DitchCarbon platform Emissions Overview bar chart of Scope 1, Scope 2 and Scope 3 totals from 2015 to 2024, dominated by Scope 3
DitchCarbon platform screen showing a self-reported "Scope 1 Total" card of 2,405 tCO2e (2024)
DitchCarbon platform screen showing a self-reported "Stationary Combustion" card of 2,168 tCO2e (2024)
DitchCarbon platform screen showing a self-reported "Mobile Combustion" card of 67 tCO2e (2024)
DitchCarbon platform screen showing a self-reported "Fugitive Emissions" card of 64 tCO2e (2024)
DitchCarbon platform screen showing a self-reported "Scope 2 Total" card of 4,044 tCO2e (2024)
DitchCarbon platform screen showing a self-reported "Purchased Electricity" card of 2,305 tCO2e (2024)
DitchCarbon platform screen showing a self-reported "Purchased Steam" card of 1,602 tCO2e (2024)
DitchCarbon platform screen showing a self-reported "Purchased Heat" card of 127 tCO2e (2024)
DitchCarbon platform screen showing a self-reported "Market-based" card of 4,044 tCO2e (2024)
DitchCarbon platform screen showing a self-reported "Scope 3 Total" card of 886,448 tCO2e (2024)
DitchCarbon platform screen showing an active "Reduction Actions" card with 24 climate initiatives disclosed
DitchCarbon platform card showing Emission Targets: 1 active target, tagged SBTi
DitchCarbon platform screen showing a Sources card with 5 documents and assurance coverage of 0/5 for Scopes 1 to 3
DitchCarbon platform card showing Emission Targets: 1 active target, tagged SBTi
DitchCarbon platform screen showing a Sustainability Score gauge reading a DitchCarbon Score of 38
DitchCarbon platform card showing an Industry Benchmark for Retail Trade Services: 77th, top 23% of industry, rated Very Low
DitchCarbon platform card showing Sustainability Programs: 2 active initiatives, including Reduction Actions
DitchCarbon platform screen showing a "Targets Tracking" card reading "No targets available"
DitchCarbon platform screen showing an "Emissions Forecast" panel reading "Insufficient data for forecast"
DitchCarbon platform Emissions Overview bar chart of Scope 1, Scope 2 and Scope 3 totals from 2015 to 2024, dominated by Scope 3
DitchCarbon platform screen showing a self-reported "Scope 1 Total" card of 2,405 tCO2e (2024)
DitchCarbon platform screen showing a self-reported "Stationary Combustion" card of 2,168 tCO2e (2024)
DitchCarbon platform screen showing a self-reported "Mobile Combustion" card of 67 tCO2e (2024)
DitchCarbon platform screen showing a self-reported "Fugitive Emissions" card of 64 tCO2e (2024)
DitchCarbon platform screen showing a self-reported "Scope 2 Total" card of 4,044 tCO2e (2024)
DitchCarbon platform screen showing a self-reported "Purchased Electricity" card of 2,305 tCO2e (2024)
DitchCarbon platform screen showing a self-reported "Purchased Steam" card of 1,602 tCO2e (2024)
DitchCarbon platform screen showing a self-reported "Purchased Heat" card of 127 tCO2e (2024)
DitchCarbon platform screen showing a self-reported "Market-based" card of 4,044 tCO2e (2024)
DitchCarbon platform screen showing a self-reported "Scope 3 Total" card of 886,448 tCO2e (2024)
DitchCarbon platform screen showing an active "Reduction Actions" card with 24 climate initiatives disclosed
DitchCarbon platform card showing Emission Targets: 1 active target, tagged SBTi
DitchCarbon platform screen showing a Sources card with 5 documents and assurance coverage of 0/5 for Scopes 1 to 3
DitchCarbon platform card showing Emission Targets: 1 active target, tagged SBTi
Team members gathered around a long meeting table with laptops, with a video call on a wall screen

Ready to see what we hold on your own list?

Upload a supplier list or a portfolio and see the same records for your own organisations: emissions, climate targets and target progress, with the source behind every figure.

Check coverage on your own list

How does the data get from a disclosure to your baseline?

Identify data

DitchCarbon matches the organisation first, using entity resolution against DUNS, LEI and ISIN identifiers, plus VAT numbers, company names and websites where those are what you hold. Matching runs against a tier-one global financial data provider, and parent and subsidiary relationships resolve to the right entity, so one supplier does not arrive as three records.

Normalise data

Emissions data arrives in different formats, units and category names. DitchCarbon standardises it against GHG Protocol criteria, converts figures to kgCO2e or kgCO2e per unit of spend, and maps local terminology to the correct scope. Anything that does not fit a standard category is flagged for manual review.

Enable action

Validated data feeds reporting, benchmarking and decisions. You can open the audit trail behind any figure, compare an organisation against industry and location peers, and forecast against that organisation's own target trajectory using disclosure quality and reduction commitments.

01
02
03
04
05
Identify data

DitchCarbon matches the organisation first, using entity resolution against DUNS, LEI and ISIN identifiers, plus VAT numbers, company names and websites where those are what you hold. Matching runs against a tier-one global financial data provider, and parent and subsidiary relationships resolve to the right entity, so one supplier does not arrive as three records.

Extract data

Once the organisation is matched, DitchCarbon gathers emissions information from public disclosures, company websites, third-party portals, supplier uploads, and PCF or LCA files. Irrelevant documents are filtered out. Everything kept is linked back to the page it came from.

Normalise data

Emissions data arrives in different formats, units and category names. DitchCarbon standardises it against GHG Protocol criteria, converts figures to kgCO2e or kgCO2e per unit of spend, and maps local terminology to the correct scope. Anything that does not fit a standard category is flagged for manual review.

Validate data

The normalised data is checked against existing records and anomaly signals. Anything inconsistent goes to a team of 15 analysts for review before it enters the dataset.

Enable action

Validated data feeds reporting, benchmarking and decisions. You can open the audit trail behind any figure, compare an organisation against industry and location peers, and forecast against that organisation's own target trajectory using disclosure quality and reduction commitments.

Continuous refresh, with documented sources

How much of my supplier list will you already cover?

More than most teams expect, and the answer arrives fast. A recent deployment reached about 60% of a large supplier base within 2 weeks, starting from public data before any targeted outreach. This runs at production scale on supply chains of over 100,000 suppliers, and coverage gaps are shown rather than hidden, so you know which part of the baseline still needs work.
2M+

Organisations
Company emissions data including corporate-level GHG inventories, refreshed continuously with documented sources.

15

Analysts
A team of 15 analysts reviews everything the automated checks escalate.

10

Assurance providers
DitchCarbon data has been used in emissions reports subsequently assured by ten different third-party assurance providers, including Big Four firms.
Powered by published emission factor datasets: ecoinvent, CEDA, EPA, DEFRA and EXIOBASE
ecoinvent logo
EXIOBASE logo
Sphera logo
Science Based Targets logo
Defra logo
Read the DitchCarbon calculation methodology

The DitchCarbon calculator is verified to ISO 14064-3, limited assurance, by UL Solutions, renewed annually, and the emission factor methodology was independently assessed by Globus Thenken in August 2025.

No more chasing suppliers for data

A company-specific figure already exists for a great many of the organisations on a typical Category 1 list or portfolio, so you can hotspot the spend and build a baseline before a single request goes out. Where a figure does need improving, the request goes out prepopulated with what that organisation has already published, so it reviews and corrects rather than compiles, which gets a higher response rate than a cold survey. Where nothing has been disclosed and nothing comes back, the emission factor library closes the inventory and the gap is shown rather than hidden.
Science Based Targets initiative
UN Global Climate Action
CDP (Carbon Disclosure Project)
Corporate Sustainability Reports
Public databases and APIs
DitchCarbon logo
DitchCarbon Platform

Frequently asked questions

Get answers to the questions procurement and sustainability teams ask most often.

Will you help design supplier outreach and define clear allocation/boundary rules?

Yes. Outreach uses a short template that states exactly what is in scope and what is out. Organisations can submit data in whatever format they already have, and we ingest it, check it, and pass it through to the systems you already run.

How heavy is the lift for suppliers, what formats do you accept?

Light. A supplier can email a file or complete a short form with only an email address and the data to share, and we accept the formats they already have.

Do you handle product carbon footprints and quality checks, such as PACT?

Yes. We collect PCFs in any format and grade them, including data quality, whether the figure sits in the expected range, and PACT alignment scored as fields present out of the full set.

How do you resolve supplier identities (entity resolution)?

Entity resolution against DUNS, LEI and ISIN identifiers, and we also accept company name, VAT number, website or email address. Matching runs against a tier-one global financial data provider, so parent and subsidiary relationships resolve to the right entity.

What data integrity checks do you run?

Extracted data is validated automatically against anomalies and historical patterns. Anything that fails goes to a team of 15 analysts before it enters the dataset.

Can we see original source documents and assurance status?

Yes. Every figure is linked to its source, deep linked to the exact page, and shows the level of third-party assurance behind it. Every figure also carries its change history.

How quickly can we achieve coverage?

Numbers you can defend within 2 weeks. A recent deployment reached about 60% of a large supplier base within 2 weeks, starting from public data before any targeted outreach.

Do you cover private companies?

Yes. Private companies are where most supply chains and portfolios go dark, and they are covered in the same dataset as listed ones. Where a private company has disclosed nothing, the record says so rather than hiding the gap behind a generic figure.

How is a figure calculated when a company has not disclosed anything?

One of four methods produces every figure: the organisation's own reported data, product data from a published carbon footprint, activity data from what was actually consumed, or industry data where nothing better exists. Industry data is fourth of four and used only where the first three could not be found. The method is a filterable column, so the share of your baseline still resting on a generic factor is a number you can read off.

Will our auditor accept it?

That determination is your auditor's, and here is what we can tell you. DitchCarbon data has been used in emissions reports that were subsequently assured by ten different third-party assurance providers, including Big Four firms. The calculator itself is verified to ISO 14064-3 at limited assurance by UL Solutions, renewed annually. Both reports are downloadable from the trust centre.

How does this line up with PCAF data quality scores?

In the financed emissions view, each counterparty carries a PCAF data quality score, usually shortened to a DQ score, so a DQ 1 or DQ 2 figure is distinguishable from a DQ 4 or DQ 5 one at the line level rather than across the portfolio. Counterparty emissions and target status sit in the same record, so a PCAF calculation can be evidenced line by line.

Someone has asked us for our own emissions data. Can we use this?

Yes, and it is free. Claim your profile, answer once, and every team that asks reads the same answer instead of sending you another form. Forward a buyer's survey by email or upload it and it joins a queue answered from your profile.

Check coverage on your own list

Upload a supplier list or a portfolio and see which organisations DitchCarbon already holds emissions data for, and which ones need work.

Being asked for your own emissions data? Claim your profile, answer once, and every team that asks reads the same answer.

Get free SBTi API access

Request your API key to start tracking science-based targets, net-zero commitments, and supplier climate progress at scale.