
.svg)

Scope 3 calculation and reporting without the manual work
Send your supplier data as it arrives. We run a hybrid calculation, assured at both ends, and return a figure your auditor can sample. You have to report Scope 3 this year, and you may already be doing the calculation: a spend export, a folder of supplier reports, a few product footprints, a spreadsheet that took a consultant three months. Give us that data, in any format and at any level of granularity, and we run a hybrid calculation on it: the most accurate method available for every line, third party assured for data capture and for calculation method, with the source document and its level of assurance behind every figure. The suppliers who have published are already covered, from verified emissions data for over 2 million organisations, built on primary emissions data wherever it exists, so most of the work is done before your file arrives. Numbers you can defend within 2 weeks.


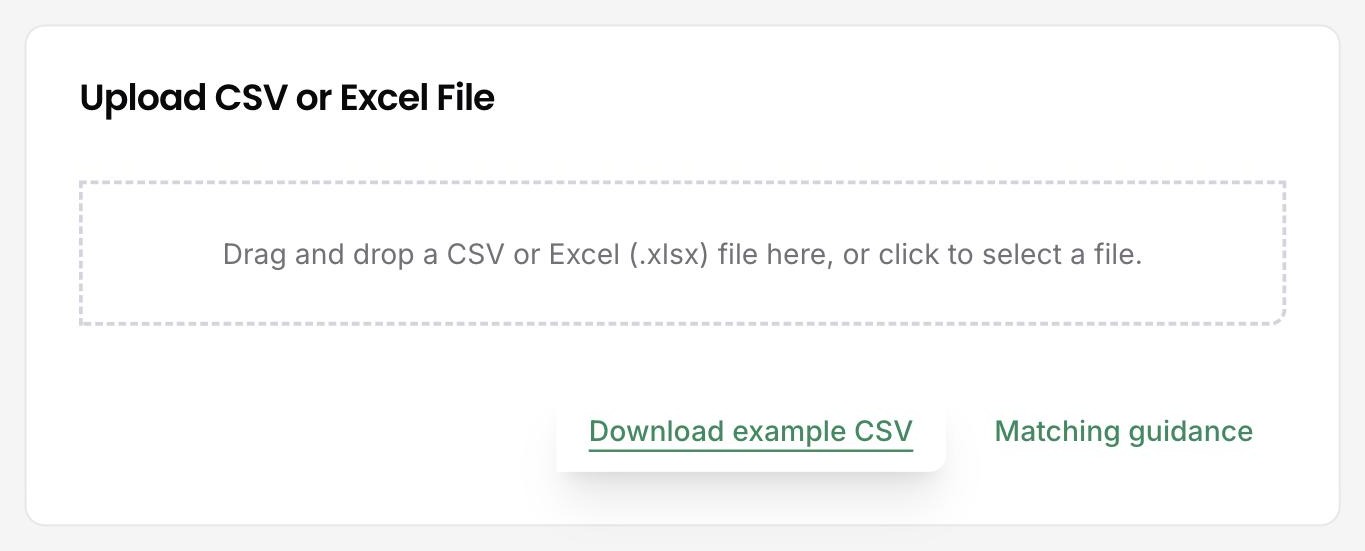
Send supplier data in whatever format it arrives

A hybrid calculation: the most accurate method for every line, industry factors last

Data capture and calculation method both third party assured

The source document and its assurance level behind every figure

Numbers you can defend within 2 weeks
Explore this use case
What data do I need to send, and in what format?
Whatever you have, as it is. A spend export straight out of the ERP, supplier reports as PDFs, a product carbon footprint or EPD for one item, electricity or fuel data for a site, the spreadsheet that came back from last year's survey. DitchCarbon reads all of it. Every supplier is matched against DUNS, LEI and ISIN identifiers, so the name in your ledger and the organisation that published the report are the same record, and each piece of data is placed at the level it belongs: organisation, product, facility or activity.
You send the data as it is. The calculation starts without a cleanse, a template or an integration project, which takes the part of why Scope 3 is hard to get right that usually eats the reporting calendar off your desk first.
Most of the calculation is done before your file arrives. The suppliers who have published are already covered, so the first pass returns a figure for the whole list, and the data you send improves specific lines rather than filling a blank. That is why the number comes back inside two weeks rather than at the end of the annual consultant engagement, and why it can be rerun for any reporting year from the spend held against that year.
The old way: three months of cleansing a spend file into a template before anyone can calculate anything.
The new way: a spend export sent as it is and a figure back within 2 weeks.
How does a hybrid calculation work?
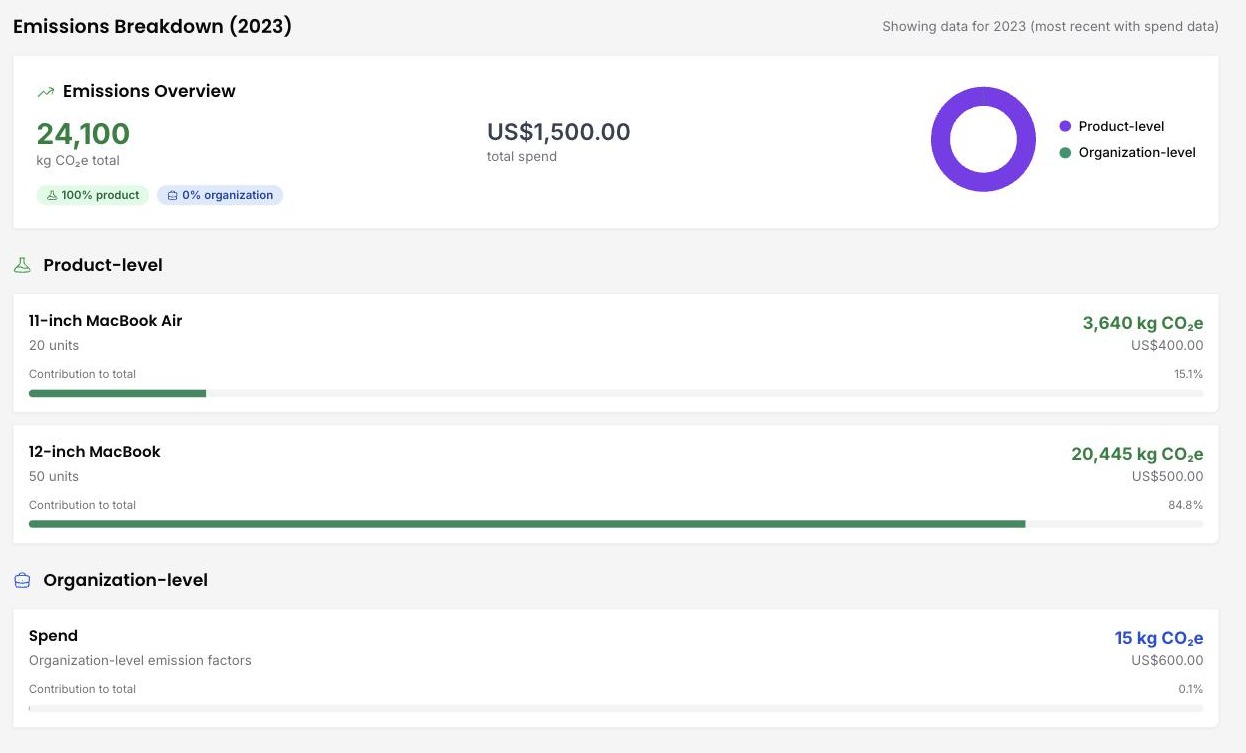
A hybrid calculation gives every line the most accurate method available and uses an industry factor only where nothing better exists. It is one calculation, not several run side by side, and each line records which method it used. The order is fixed, and it starts at the top:
- Product level. A product carbon footprint for the item you bought, validated and matched to the line.
- Activity or service level, disclosed by the supplier. The supplier's own electricity, fuel or service footprint, applied to what you bought from it.
- Generic activity data. The activity is known but the supplier's own factor is not, so it is calculated on a published factor such as ecoinvent.
- Primary emissions data applied to spend. The supplier's own reported inventory, from its published report, applied to your spend with it.
- Industry level spend. A sector average, used only where nothing above it exists.
Four rungs are tried before anything falls to a sector average, and a single supplier can sit on several at once: a PCF for one item puts that item on the first rung, and the rest of the spend with that supplier goes to the highest rung available for it. The methods sit side by side on the same supplier, the split is a stated percentage, and the method column filters the list, so the reader can see at a glance how much of the figure is built on actual data rather than a sector average.
The order matters because it is the order of accuracy. Spend is an input, not the enemy; the sector average applied to it is the least specific method there is, and a Scope 3 figure built mostly on it says more about your sector than your suppliers. The hybrid calculation puts the sector average last, states how much of the total still rests on it, and gives you the list of suppliers that would move it.
The old way: one spend based factor applied to every line and a footnote saying so.
The new way: five methods in order of accuracy, the best one for each line and the split stated.


How much of my Scope 3 number is actual data rather than estimate?
A proportion you can read off the screen. The calculation method breakdown groups every line into organisation, product and activity data on one side and industry data on the other, and shows each as a share of the total. The method column filters the list to any one of them, and the headline toggles between supplier-specific and industry factors, so the question an assurance provider asks first, what share of this figure is primary data, has an answer before it is asked.
That share is a measure of data quality, and it is the one buyers use. Where the industry share is high, the breakdown is also a list of the suppliers behind it, ranked by how much of the total they carry, which is exactly the list to send a request to. The asking is the Supplier engagement page's job; this page shows you how far the calculation already got without it and what it would take to move the proportion.
Coverage gaps are shown, not hidden. A line that landed on the sector average says so, and it stays visible in the breakdown until a better method replaces it. That is what lets the same figure be reported honestly this year and improved next year without the method changing under it.
The old way: a single total and no way to say how much of it is real.
The new way: the share on each method as a percentage and the suppliers behind the estimate named.
What do I get back, and does it work for CSRD, CDP and ISSB?
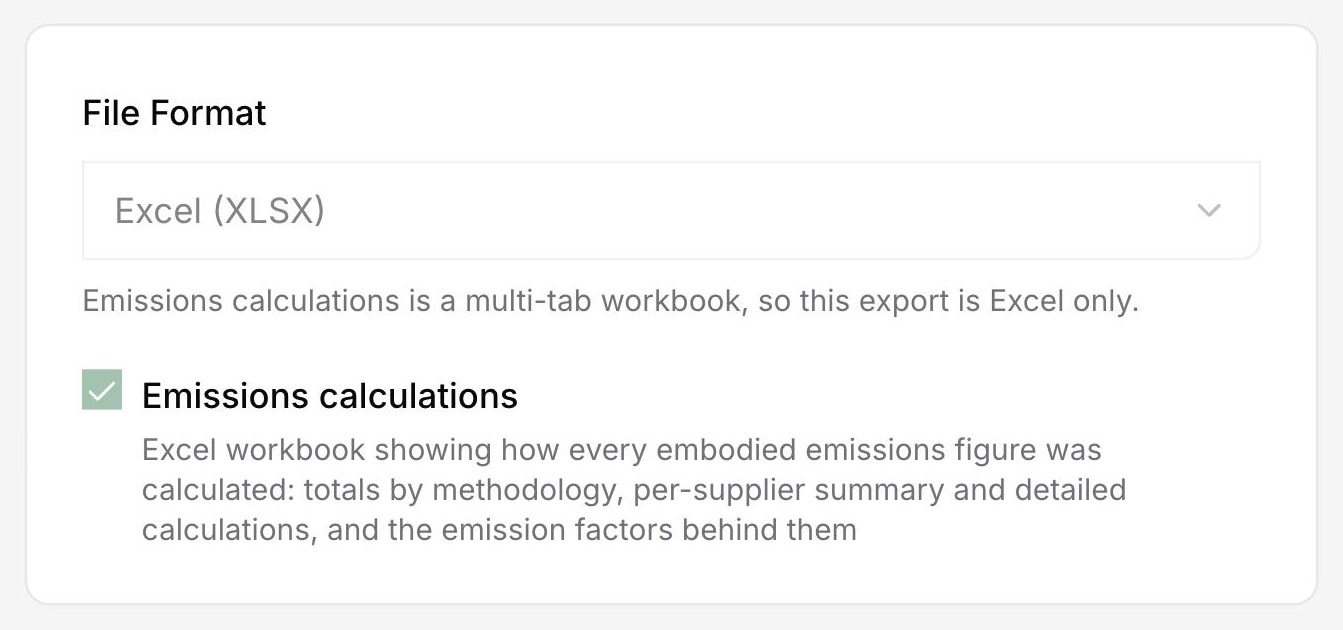
Data, not a dashboard you have to read numbers off. Every line comes back with its figure, its method, its source document and the level of assurance that document carries, exportable into whatever you report from. The same inventory serves each framework because the method travels with the figure: ESRS E1 under CSRD asks for the categories and the share of primary data, CDP for the methodology per category, ISSB for the measurement approach. One calculation, several disclosures, and no reworking between them.
Each framework is a set of questions about how the number was produced, and the record answers them. What CSRD requires on Scope 3 is a method statement per category and a view of data quality; the method breakdown and the line level export are that statement. CDP's methodology question is answered per category by the same split. ISSB asks for the measurement approach and the inputs, which is the method column and the source documents. Nothing is compiled by hand for one framework and reconciled to another.
The same source serves a portfolio as well as a supply chain. If part of your reporting is financed emissions, the Financed emissions page covers the counterparty side from the same data.
The old way: a number reworked three times for three frameworks.
The new way: one line level export with the method and source on every row, read into each disclosure as it is.
How to evaluate carbon software for CSRD: a buyer's checklist
Will my assurance provider accept a calculation done this way?
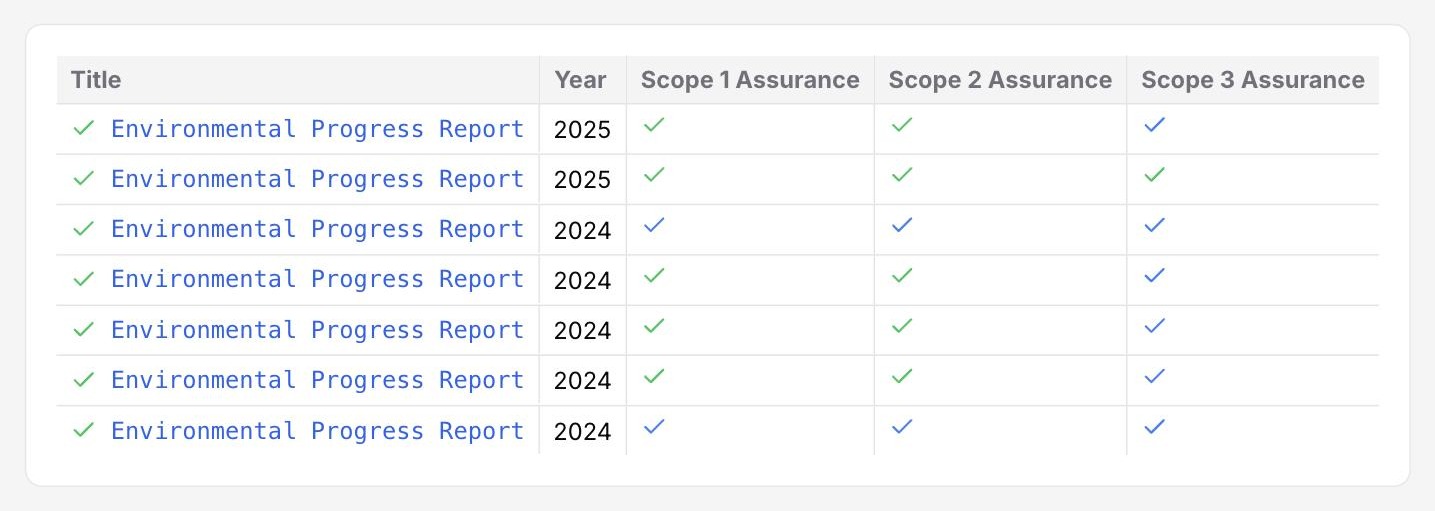
The process is assured at both ends, and every figure carries its own evidence. Data capture is annually assured by UL Solutions, so how a figure was extracted from a supplier's report is covered. The calculator is verified to ISO 14064-3, limited assurance, by UL Solutions, renewed annually, so how the figure was calculated is covered. The emission factor methodology was independently assessed by Globus Thenken, August 2025. Extraction, calculation and factors: each has a document behind it, and the verification documents are published for your auditor to read.
Then the figure itself. Every line carries its source document, the sentence in that document the figure came from, the method used and the change history since. The source document panel also shows the level of third party assurance the supplier's own report holds, reasonable, limited or none, who provided it and the statement they gave, so an auditor sees not only where your number came from but how far the supplier's figure had been checked before it reached you. That is what turns a sample request into a ten minute exercise: pick a line, open the document, read the sentence.
DitchCarbon data has been used in reports subsequently assured by ten different third party assurance providers, including Big Four firms, and by Fortune 100 companies in their sustainability reports. It is the only specialist Scope 3 tool with third-party assurance of its calculation methodology (who is really verified sets out the benchmark), and the first company to earn UL Solutions' Calculator Verification, June 2025. Audit-ready, in the sense that the phrase actually requires, means the ISO 14064-3 verification and the source document on every line, and this page never uses the word without both.
The old way: a black box figure from a data vendor, taken at face value once a year.
The new way: a calculation assured at both ends and a source document behind every line your auditor can sample.
Source documents · How to build assurance-ready Scope 3 evidence
If you are the organisation being reported on
Your customers' Scope 3 figures are calculated from what you have published. Claim your profile to check the figure, the source and the method, and correct it once for everyone who reports on you.
Related articles


.jpeg)



Frequently asked questions
Get answers to the questions climate-risk and sustainable-finance teams ask most often.
Send a sample of your supplier data and see the calculation come back
Send a sample of your supplier data, in whatever format you have it. We run the hybrid calculation on it and show you the method mix, the figures and the source documents that come back.

