
Product carbon footprints, validated, matched and used
Validate every supplier PCF, match it to what you buy, and calculate the line on the product's own footprint. You asked your strategic suppliers for product carbon footprints and they have started to arrive: a PDF here, an EPD there, a spreadsheet with a number and no boundary. Somebody now has to decide whether each one can be trusted, work out which purchases it applies to, and get it into the calculation. DitchCarbon does the three in sequence. Alongside verified emissions data for over 2 million organisations, built on primary emissions data wherever it exists, it holds published product carbon footprints for the products those organisations sell, grades every new one as it comes in, matches it to the SKUs in your spend and calculates the line on the product's own figure, so you get an accurate number you can trust rather than a spreadsheet of work. A product carbon footprint is the closest a Category 1 line gets to the real thing, and once the line sits on it, the reduction conversation can be about this material, this model and this supplier.

Every supplier PCF or EPD validated on arrival

Matched automatically to the SKUs you buy

The line calculated on the product's own footprint

The share of your baseline on product data shown as a number

Reduction plans at product level, not category level
Explore this use case
Which of my suppliers already publish product carbon footprints?
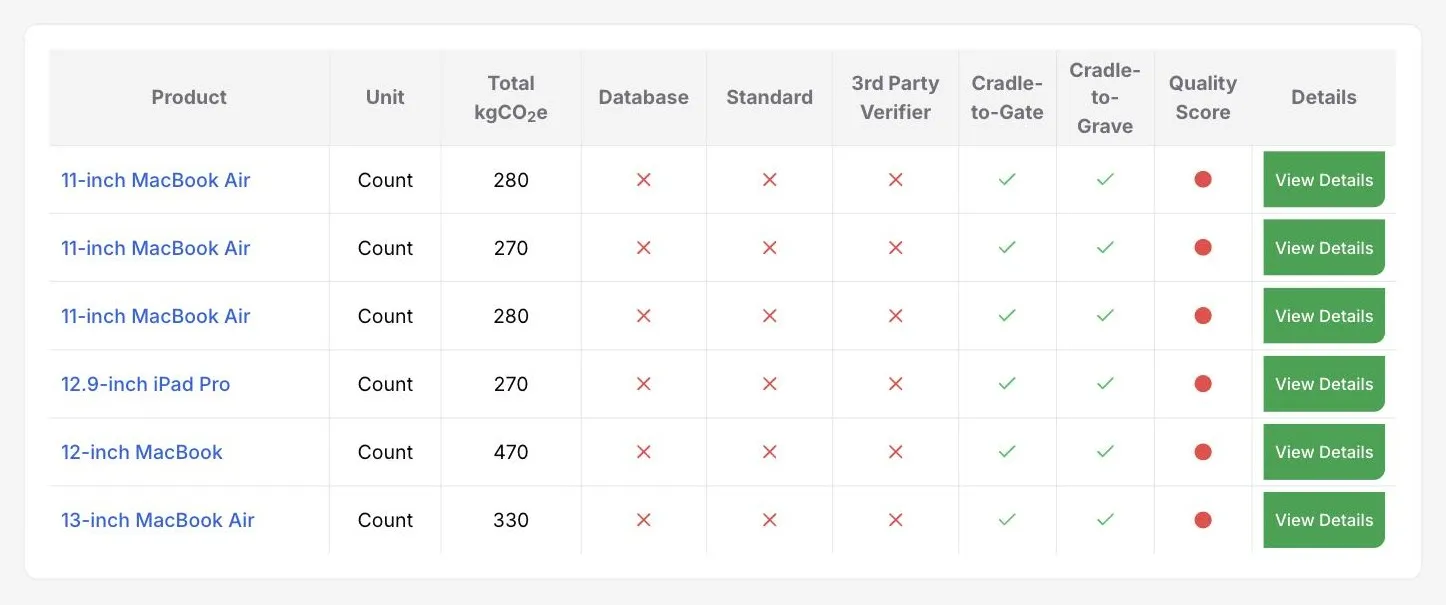
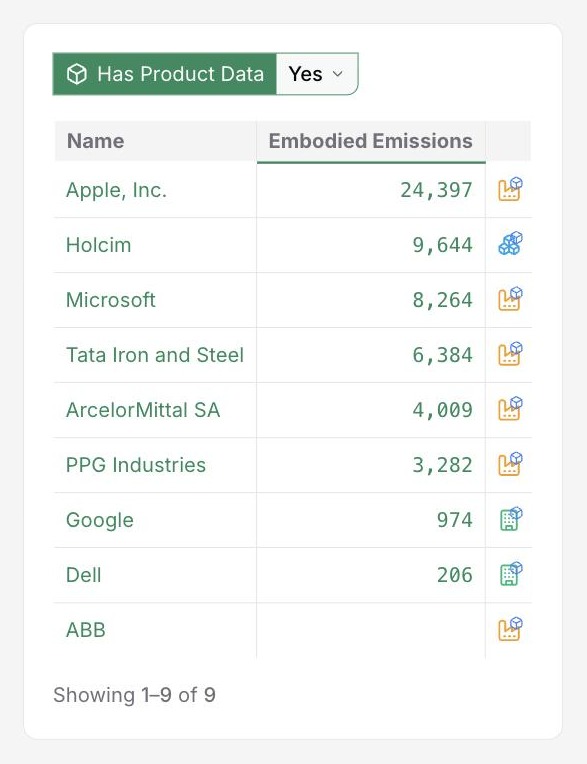
More than a request would ever surface, because many are already public. Filter your supplier list to the organisations that hold product data and each one opens on its products table: kgCO2e per unit, the standard the footprint was prepared to (ISO 14044, ISO 14067), the third party verifier where there is one, whether the boundary is cradle to gate or cradle to grave, and a quality score. Open a footprint and it decomposes further, splitting the total across manufacturing, transport, use and end of life, with the phases following the EN 15804 modules.
A footprint is only usable when you know what it covers. A cradle to gate figure and a cradle to grave figure for the same item are different numbers answering different questions, and mixing them quietly corrupts a category total. Every row on the table states its boundary, its standard and its verifier, so the comparison is explicit before the number is used, and the quality score says at a glance whether you are looking at a verified footprint or a bare figure lifted from a marketing page.
Product data is the most specific figure a line can carry, and it is the one most teams leave unused.
The old way: a PDF per product in a shared drive and no way to tell what the number covers.
The new way: every footprint on the supplier's record with its standard, verifier and boundary stated.
Product carbon footprint library · Which suppliers hold product data
How do I know a supplier's PCF can be trusted?
Because it is graded before it enters a calculation. Upload the PDF or paste the link, in bulk if you have a pile of them, and each footprint comes back with an overall quality band and a verdict on whether it can be used. Underneath sit the checks that produced it: data quality, whether the figure sits in the expected range for what it describes, checked against the company emissions data described above, PACT alignment scored as the fields present out of the full set, and an assurance breakdown covering methodology disclosure, lifecycle boundary and third party verification. Each dimension comes back good or needs review, so the person reading it knows what to go back to the supplier about.
The result is shareable and exports as a PDF and as a PACT v2.3.0 ProductFootprint in JSON, so a footprint that arrived as a static document leaves as structured data your own systems can read. The grading is a check on the supplier's document rather than an assurance of it: it tells you whether the footprint is complete, plausible and aligned, and where it falls short. The same check is available on its own as a free tool, so you can test it on a real supplier PDF before anything else.
The old way: reading a forty page EPD to find the boundary and hoping the number is right.
The new way: a graded verdict in under a minute with the fields that need attention named.
Validating and sharing product carbon footprints · Mastering PCF data for decarbonisation · PCF Evaluator

How do PCFs get matched to what I actually buy?
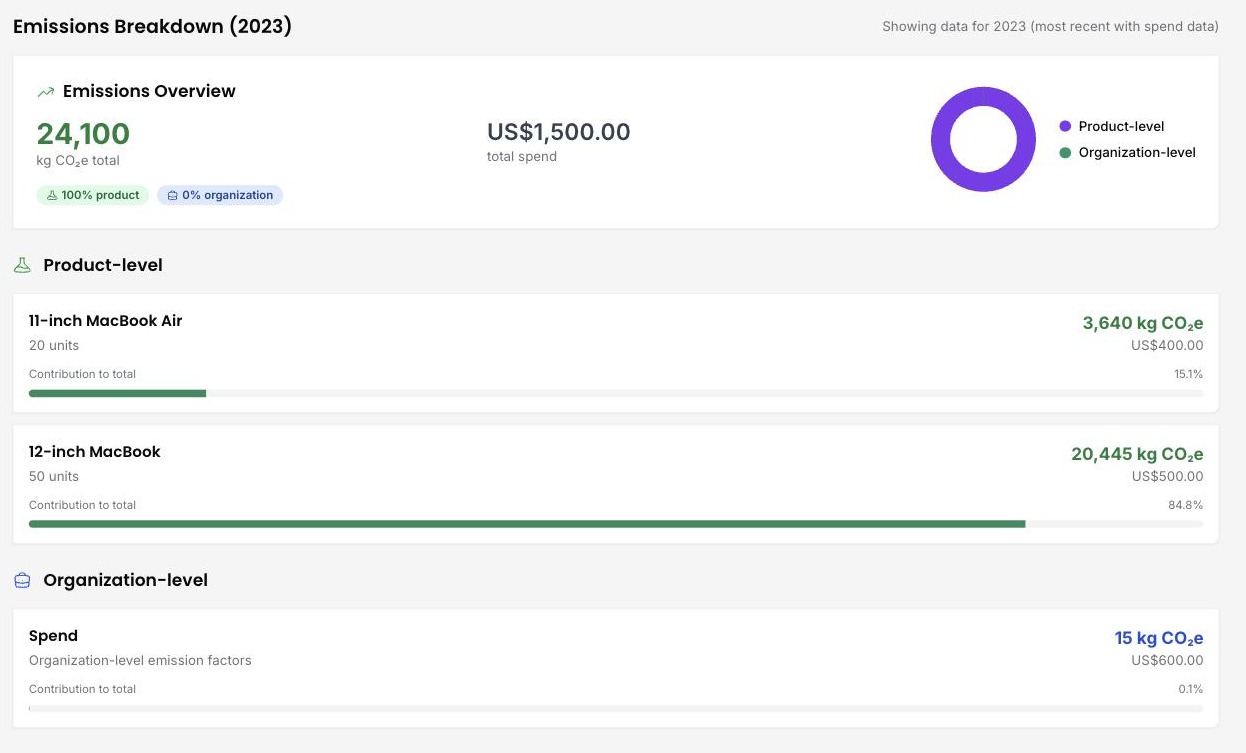
Automatically, to the SKUs in your spend. A footprint for a named model is matched to the lines where you buy that model, so the product figure lands on the right purchase without anyone keying product codes into a spreadsheet or building a lookup table by hand. The match is visible on the line, so a reviewer can see which footprint was applied to which purchase and why.
Most spend does not arrive as one homogeneous number. A hardware supplier sells specific models, each with a published footprint, and also invoices for services and support that no footprint covers. Allocation handles both on the same organisation: the product lines take the product figure, the remainder takes the organisation's own emission factor applied to spend, and each line shows units, kgCO2e, spend and its share of the total, so the two methods sit side by side and the proportion resting on the more specific one is a stated percentage. Spend is held per year, so a baseline can be rebuilt for any reporting year, and allocations can be edited after the fact with the change history travelling with the figure.
The old way: one spend line, one sector average, and the supplier's footprints sitting unused in an inbox.
The new way: product footprints on the lines they belong to and the organisation factor only for the rest.
Product footprints alongside the organisation factor · Spend allocation across products and organisation
What changes once a line is calculated on the product's own footprint?
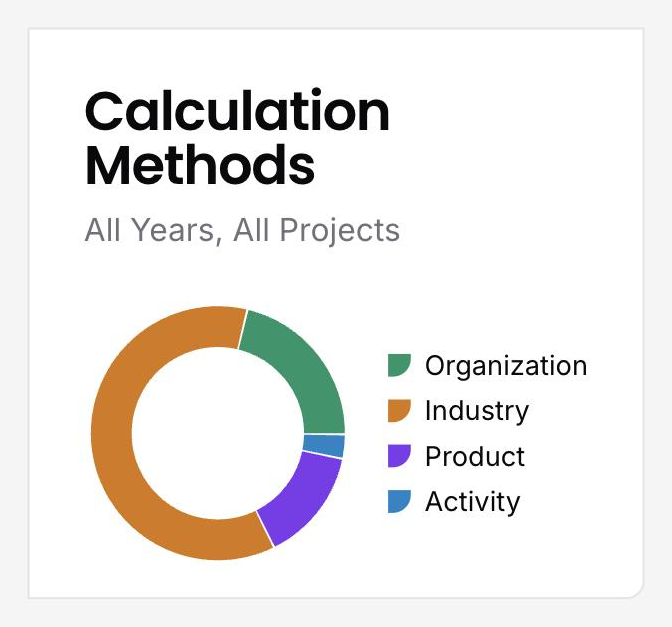
The number starts to move when the product changes, not only when you spend less. A line on a sector average falls when procurement buys less and for no other reason. A line on the product's own footprint falls when the supplier cuts the footprint, when you switch to a lower carbon model, or when you specify a different material, and each of those is a decision someone in the business can actually take. The calculation method breakdown shows the share of your baseline resting on product data alongside organisation, activity and industry data, so data quality is a proportion you can point at rather than a claim you have to make.
That is what makes the reduction conversation tactical. At category level the ask to a supplier is a target in an email. At product level it is specific: the cradle to gate figure on this SKU, the material in this component, the model that replaces this one. The ranked reduction plan picks up the same lines, so where a product footprint shows where the emissions sit, the Scope 3 decarbonisation plan says what a named peer did about it and gives you the contract clause to make it stick.
The old way: a category total that only moves with spend and a reduction target nobody can act on.
The new way: a product level figure and a conversation about the material, the model and the supplier.
From sector averages to product data · Calculation method breakdown · Product level reduction
Will my auditor accept product level figures collected this way?
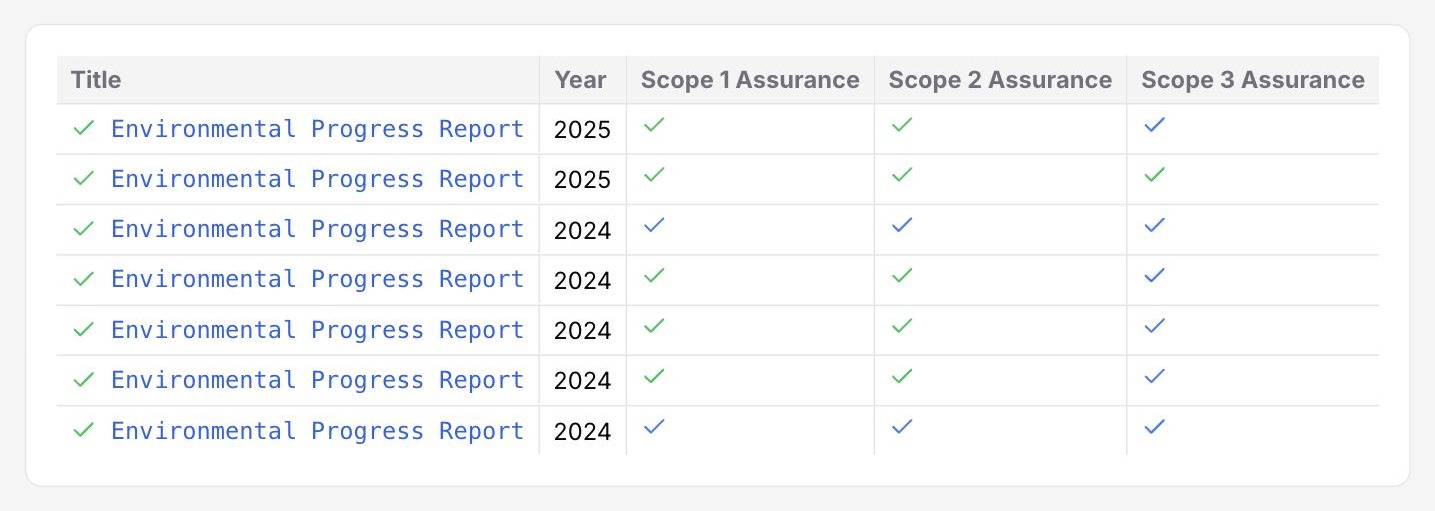
They can trace every one. Each product line carries the footprint's source document, the standard it was prepared to, its third party verifier where named, its boundary and its quality grade, and the method column records that the line used product data rather than an organisation or industry factor. The calculator the figures run through is verified to ISO 14064-3, limited assurance, by UL Solutions, renewed annually, and every figure carries its source and change history, so a sampled line can be followed back by someone who has never opened the platform.
The two kinds of check are kept distinct on the record. The Evaluator's grade describes the supplier's document. The UL Solutions verification covers DitchCarbon's calculation. Neither is presented as the other, which is the distinction an auditor will ask about first. The documents behind the verification are in the trust centre.
The old way: a number in a spreadsheet with a supplier's PDF attached somewhere.
The new way: a product line with its document, standard, verifier, boundary and method stated.
If you publish product carbon footprints
Run your PCF or EPD through the same check before you send it to a customer, so it arrives complete, PACT aligned and passes first time. Claim your profile so your published footprints sit on your record for every buyer who asks, with the standard, verifier and boundary you stated.
Related articles




Frequently asked questions
Get answers to the questions procurement, sustainability and finance teams ask most often.
The greenhouse gas emissions of a single product over a defined part of its life, expressed in kgCO2e per unit. A cradle to gate footprint covers raw materials through manufacture; cradle to grave adds use and end of life. Footprints are prepared to standards such as ISO 14067, and the boundary decides what the number means.
Yes. Under the GHG Protocol, primary data comes from specific activities in a company's value chain, and a published footprint for the product you buy is exactly that. It sits with the supplier's own reported inventory and activity data as the primary rungs; industry averages are secondary. See PCFs, primary data and sector methods.
It grades the document before the figure is used. The check covers data quality, whether the figure sits in the expected range for what it describes, PACT alignment as fields present, and an assurance breakdown across methodology, lifecycle boundary and third party verification. Each comes back good or needs review, with a usable verdict overall.
PACT is the Partnership for Carbon Transparency, whose data exchange standard defines the fields a product footprint should carry so it can move between systems without retyping. Alignment means the footprint is complete and machine readable. DitchCarbon exports a graded footprint as a PACT v2.3.0 ProductFootprint in JSON.
Automatically, to the SKUs in your spend. A footprint for a named model is matched to the lines where you buy that model, and the match is visible on the line so a reviewer can see which footprint was applied where. Nobody keys product codes into a spreadsheet or maintains a lookup table by hand.
Yes, on the same supplier. Spend allocated to named products uses each product's own published footprint, and whatever is left is calculated on the supplier's organisation emission factor. Each line shows units, kgCO2e, spend and share of total, so the proportion resting on product data is a stated percentage.
Cradle to gate covers a product from raw material extraction to the factory gate. Cradle to grave continues through distribution, use and end of life. The two are different numbers for the same item, so every footprint on a DitchCarbon record states which one it is before it is compared or used. See normalising supplier emissions.
It makes the ask specific. A line on a sector average only falls when you spend less. A line on the product's own footprint falls when the supplier cuts it, when you switch model or when you change material, so the conversation moves from a category target to this SKU, this component and this supplier.
Yes, and it is free. Upload your PCF or EPD to the PCF Evaluator and it returns the same grade a buyer would see: data quality, expected range, PACT alignment and assurance breakdown. Fix what needs review before you send it, and it arrives complete and passes first time.
See product level coverage on a sample of your own suppliers
Send a sample of your supplier list. We show which suppliers already publish product carbon footprints, which lines could move from a sector average to product data, and what the first request would ask for.