.svg)
Calculation method breakdown
DitchCarbon's calculation method breakdown shows what share of a Scope 3 baseline comes from organisation, product or activity data (primary), or industry data (secondary), so data quality is visible as a proportion.
Every line in the baseline records the method used to calculate it. The breakdown groups those methods into organisation, industry, product and activity data, and shows each as a share of the total. Data quality becomes a proportion you can point at, rather than a claim you have to make.
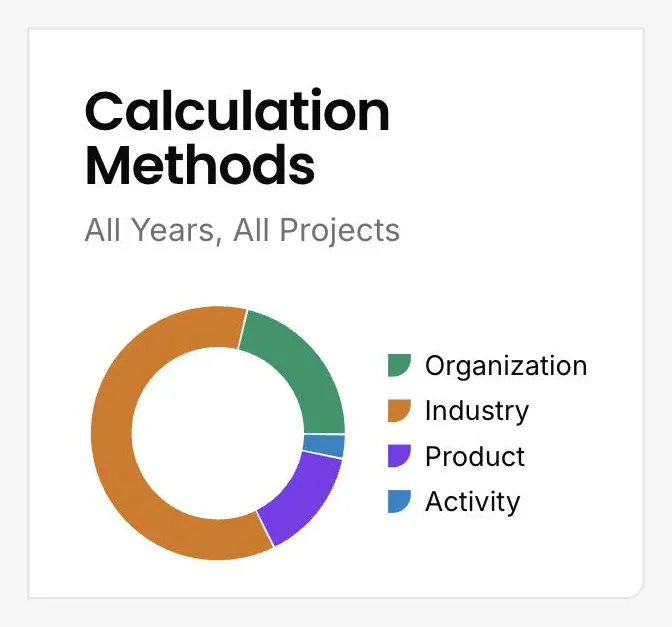
Four methods, in rough order of how close each sits to the real thing. Activity data comes from what an organisation actually consumed. Product data comes from a published product carbon footprint (primary data). Organisation data comes from an organisation's own reported emissions, which is primary data under the GHG Protocol. Industry data is the sector average, secondary data under the GHG Protocol, used where nothing better exists.
Finance teams will recognise the shape of this from PCAF data quality scores. The principle is the same: a number is only as defensible as the method behind it, and the method has to travel with the number rather than being reconstructed a year later under audit.
Every figure carries its source and change history, so an auditor can follow any line back to where it came from. That is what makes the breakdown auditable rather than decorative.
DitchCarbon data has been used in emissions reports that were subsequently assured by ten different third-party assurance providers, including Big Four firms.
Common questions

See it on your own suppliers, portfolio or profile
Numbers you can defend within 2 weeks, or one profile that answers every buyer asking.


