.svg)
Calculate
Activity data where you have it
Can I use actual consumption data instead of spend?
Yes, line by line. Each allocation line is set to Product or Activity, and an Activity line searches a factor library by name, returning the unit, the geography, the factor and the database it came from. Enter a quantity and the line calculates on that rather than on spend.
Line item breakdown behind every figure
Can I see exactly what is behind this number?
Click any embodied emissions figure and it opens as its own calculations, one row per year. Each row names the methodology, the description it was calculated against, the quantity where there is one, the emission factor applied with its units, the spend, and the source the factor came from.
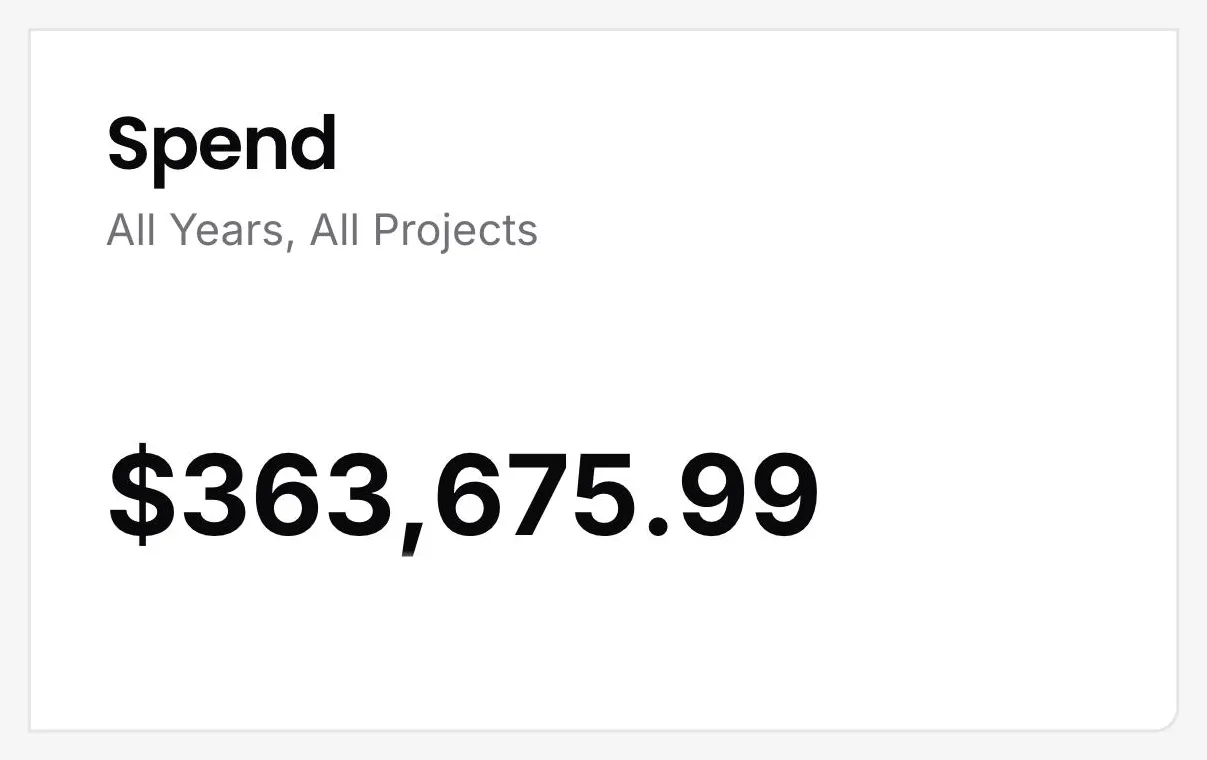
Spend under measurement
How much of my spend is behind this number?
The spend total sits next to the emissions total, on the same filters. Reading the two together is what makes an intensity figure possible, and it is the first check on whether a baseline covers the spend a team thought it covered.
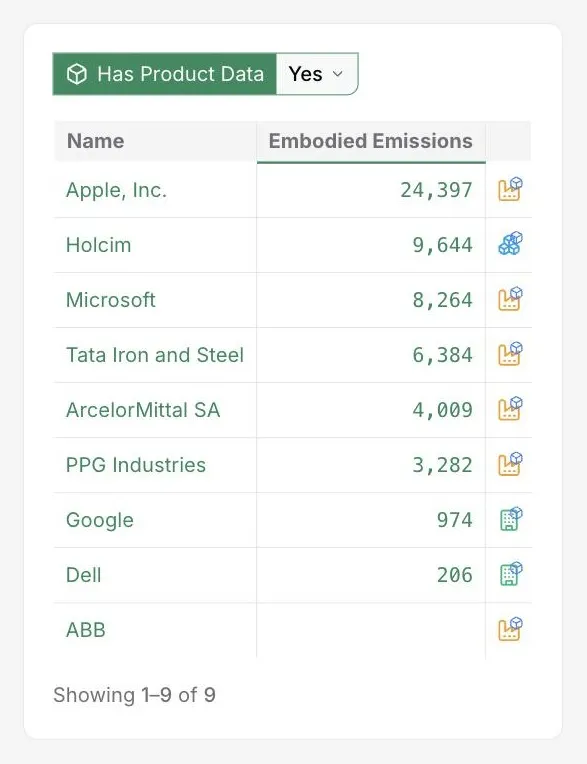
Product carbon footprint availability
Which suppliers have product level carbon data?
A filter isolates the organisations that hold product data, and the emission factor method marker shows where a product carbon footprint was used instead of a spend based figure. Product data is the closest method to the real thing, so those rows are the strongest part of a baseline.
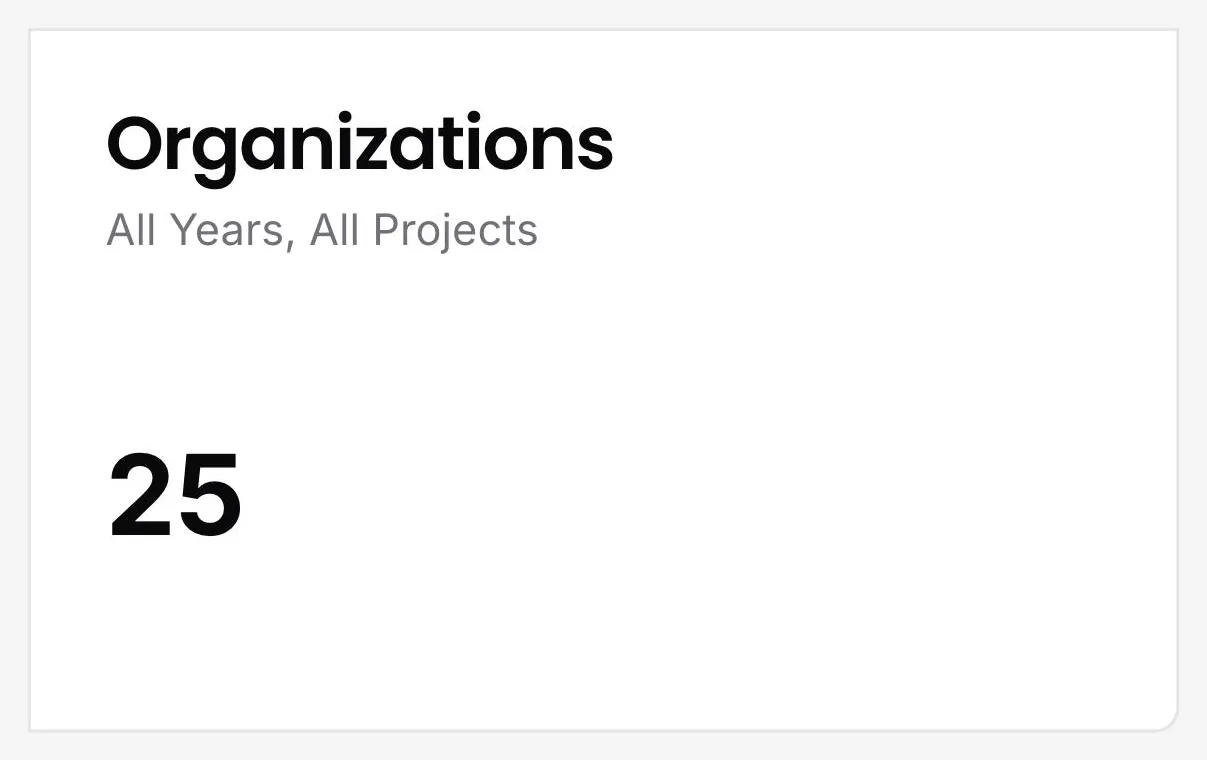
Organisations under measurement
How many suppliers are actually in this baseline?
A count of the organisations in the current view, moving with the filters. It answers the question that follows any total: how many organisations produced it, and is that the number the team expected to be measuring. Where the count comes in lower than expected, entity matching is the first place to look.
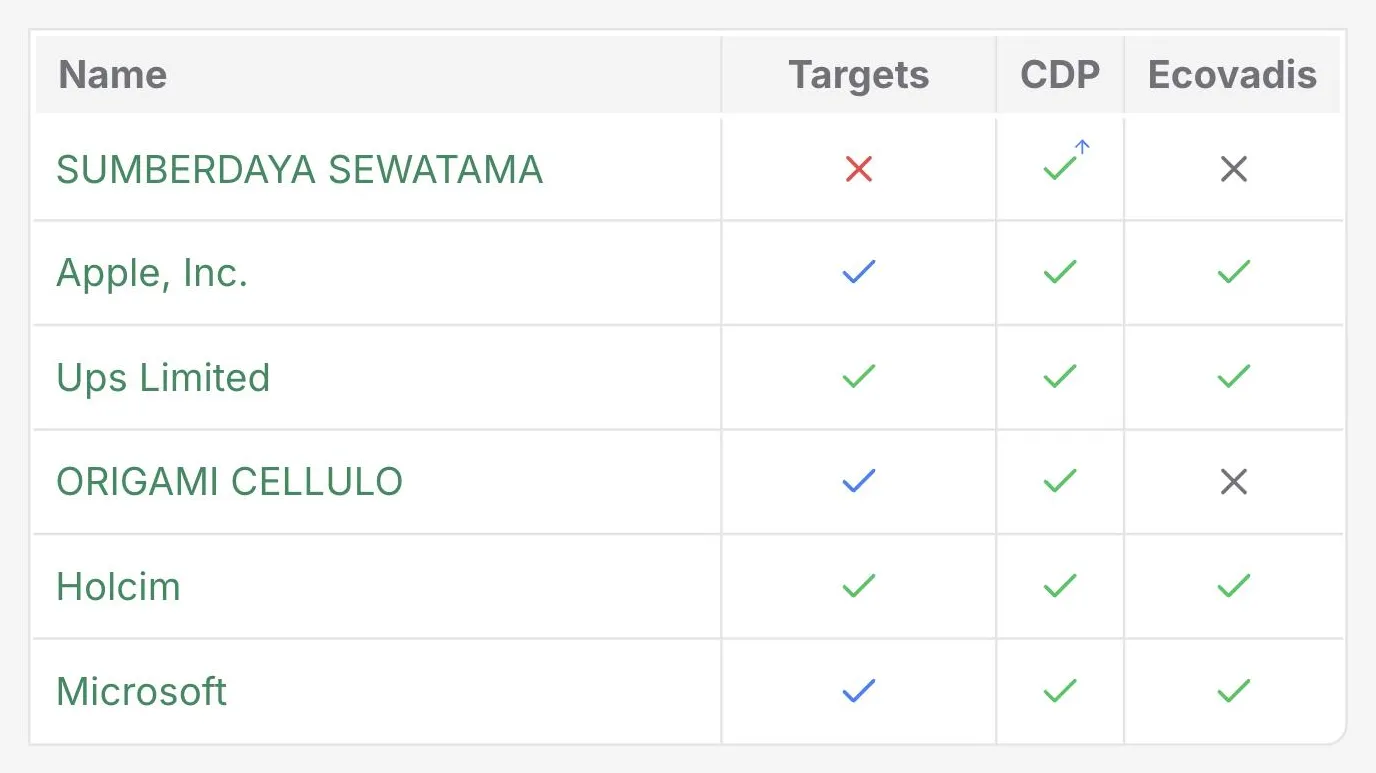
EcoVadis rating alongside emissions
Can I see EcoVadis ratings next to emissions data?
EcoVadis is available as a column and as a filter, so a rating a team already relies on sits beside the emissions figure rather than in a separate portal. Organisations can be narrowed to those holding a rating, or to those without one.
Supplier and portfolio table
Where do I see every supplier's emissions in one list?
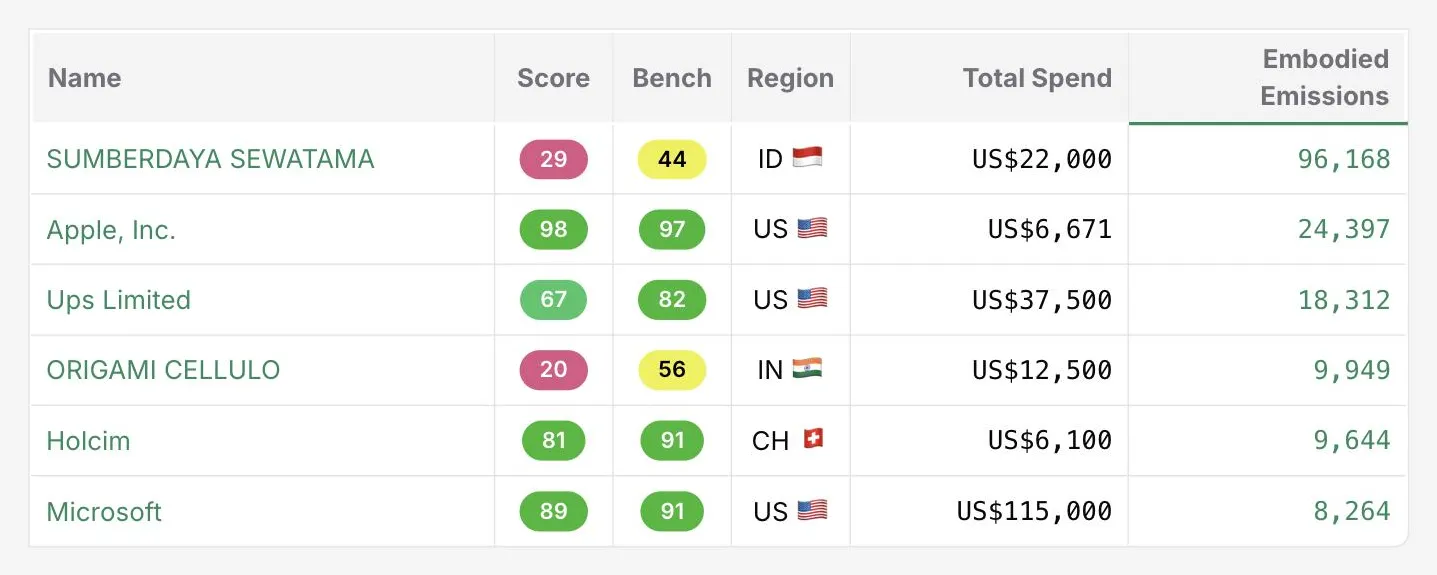
One table, one row per organisation. Each row carries the DitchCarbon score, the industry benchmark for that score, region, total spend, embodied emissions, the emission factor method used, target status and whether the organisation disclosed to CDP. Sort on any column to put the organisations that matter at the top.
Scope 3 baseline from your vendor list
How do I get a Scope 3 number I can defend?
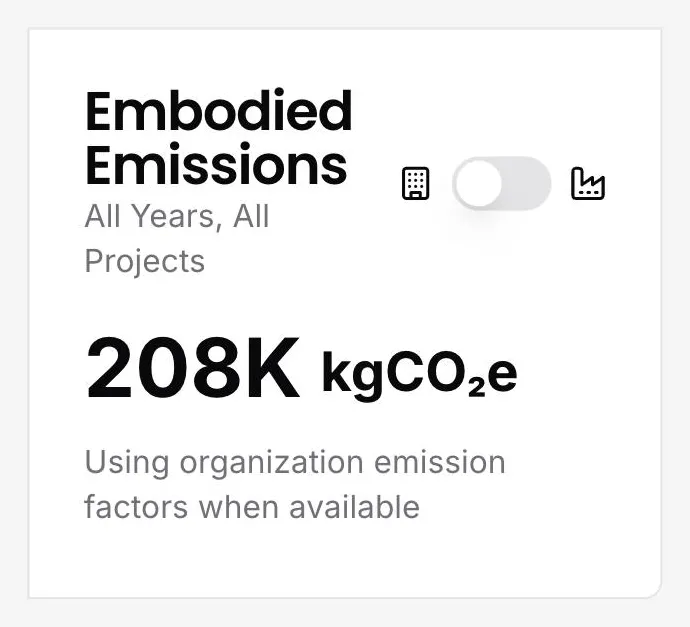
Load a vendor list and the spend against it. DitchCarbon returns a total in kgCO2e for the whole portfolio, and says underneath which basis produced it, organisation emission factors where an organisation has published them. Numbers you can defend within 2 weeks, without asking a single organisation for anything.
Project based segmentation
Can I keep different parts of the business separate?
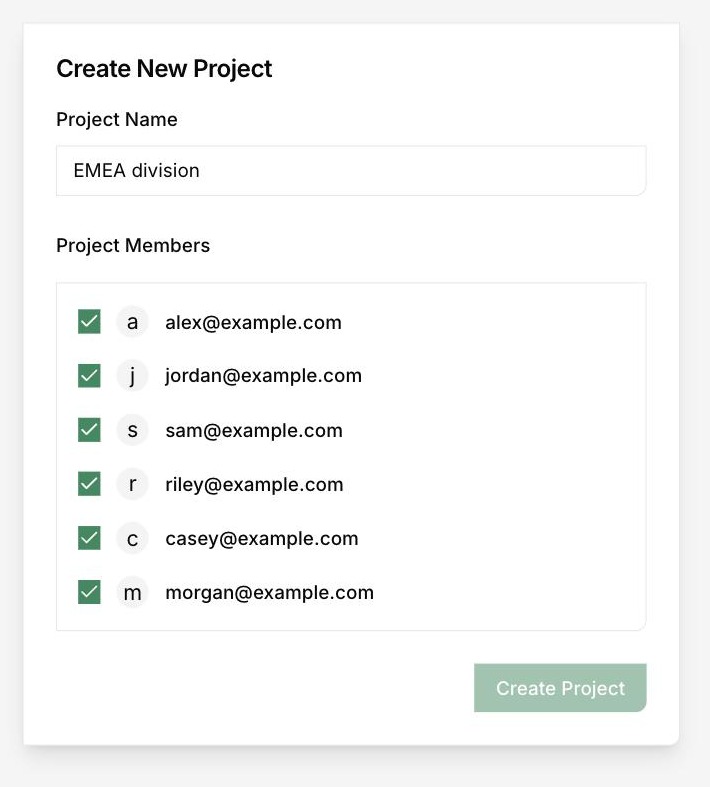
Projects separate one set of organisations and spend from another inside the same account. A division, a legal entity, a reporting year or a consultancy's individual client each gets its own project, and any figure can be read for one project or across all of them.
Portfolio filters
Can I narrow this to one year, region or industry?
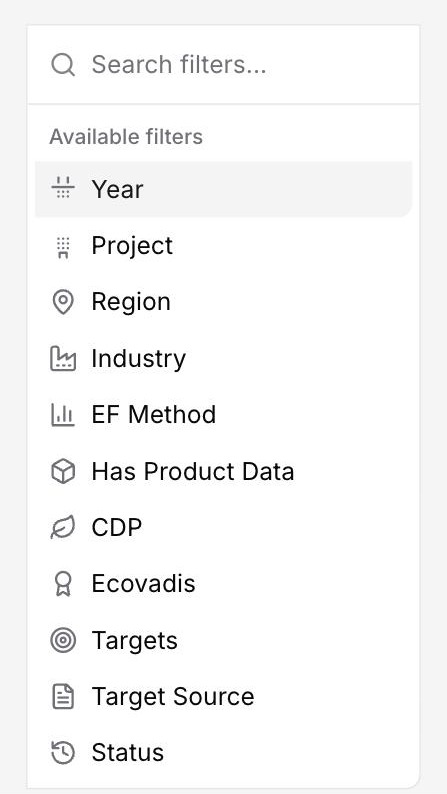
Eleven filters, combinable: year, project, region, industry, emission factor method, whether product data exists, CDP status, EcoVadis rating, target status, where a target came from, and organisation status. Year and project also rescope the headline figures above the table, so the totals belong to the view.
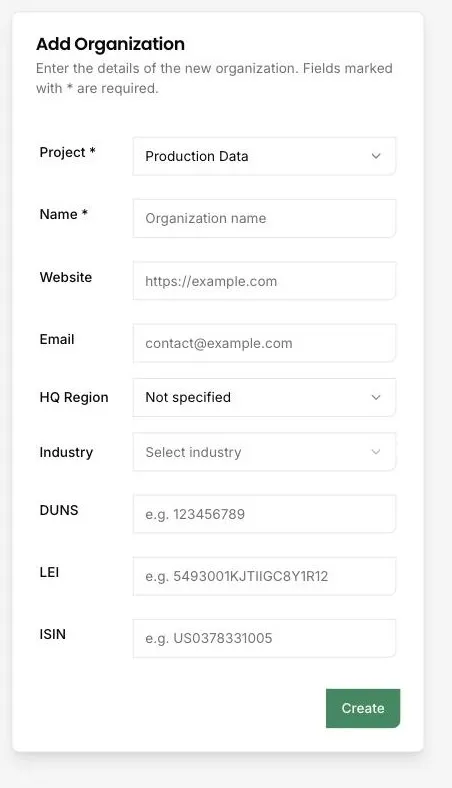
Entity matching on DUNS, LEI, ISIN and VAT
How do you make sure the emissions land on the right legal entity?
Identifiers, not name matching. An organisation can be added or matched on DUNS, LEI, ISIN or VAT number, with website domain, email, HQ region and industry as supporting signals. Parent and subsidiary relationships are resolved as well, so a figure attaches to the entity you buy from rather than the group above it.
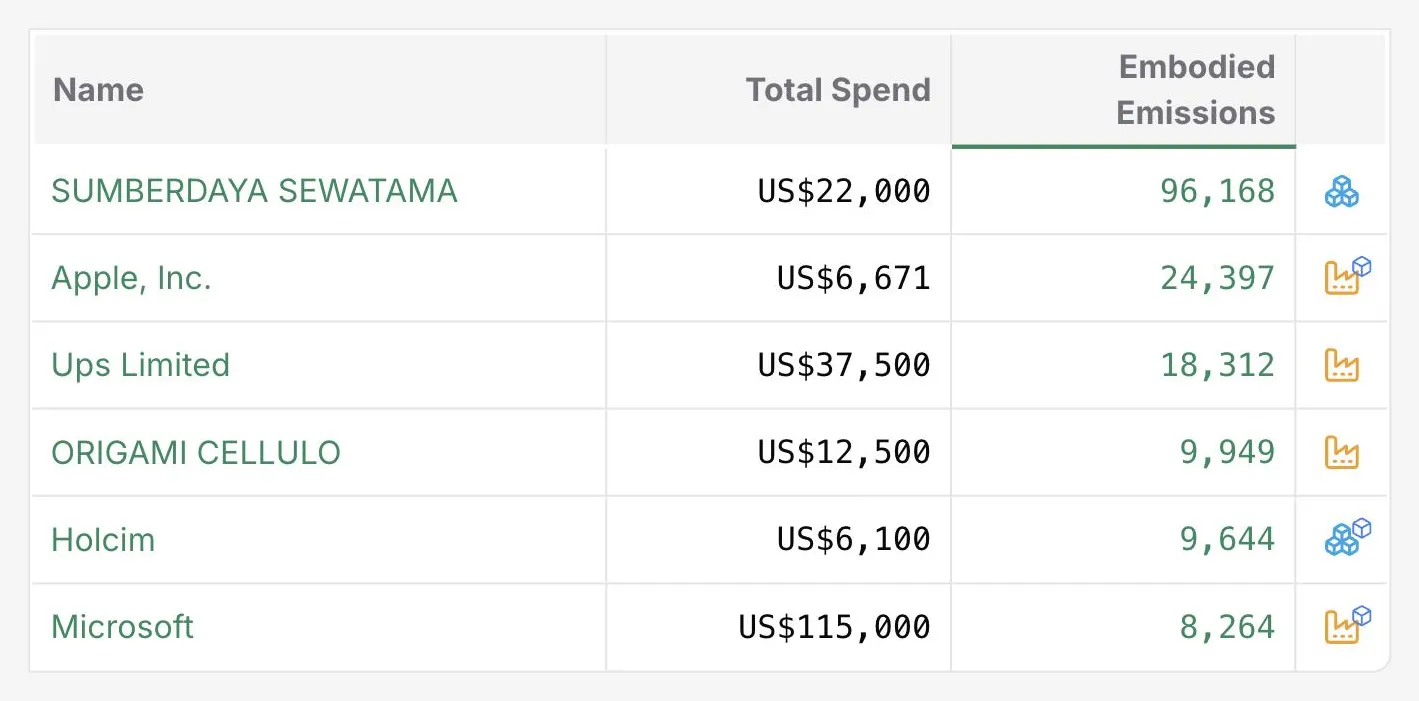
Emission factor method on every organisation
How do I see which method was used for each supplier?
Each row carries its own method marker: organisation data where the organisation published its own emissions, product data from a published product carbon footprint(primary data) , activity data (primary data) from what was actually consumed, or industry data where nothing better exists. Filter the table on the method to isolate the rows resting on a sector average, the secondary data method under the GHG Protocol.
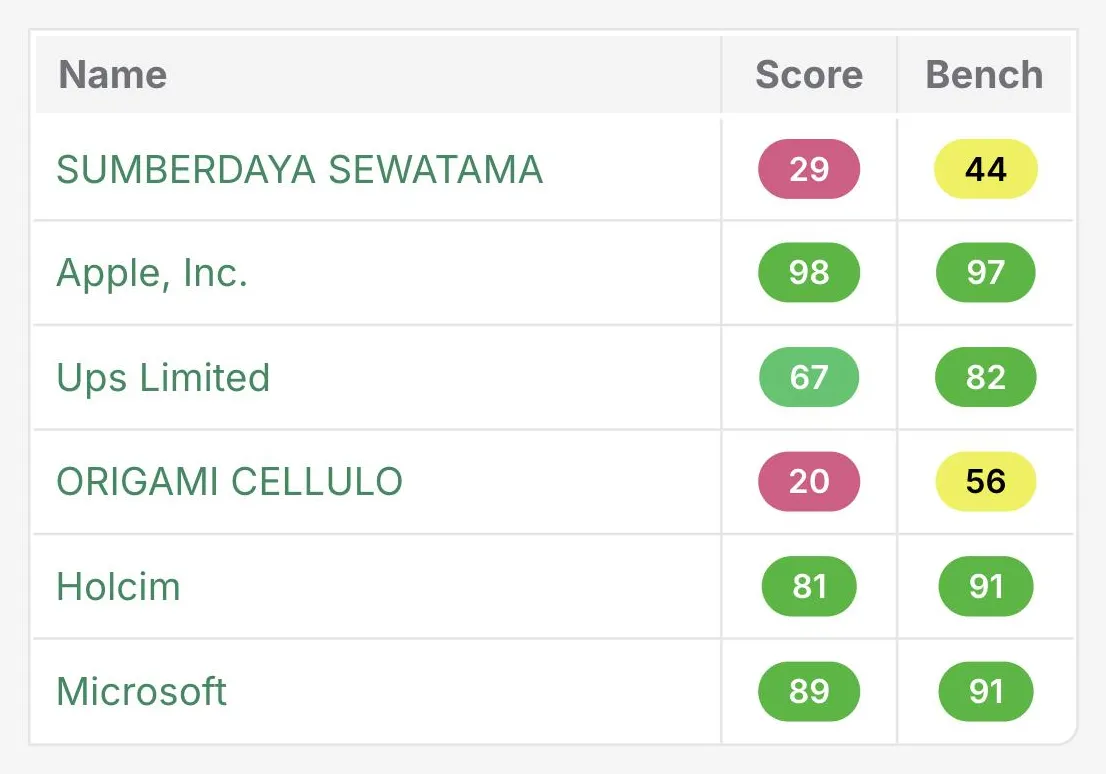
DitchCarbon score against the industry benchmark
How do I tell a good supplier from a bad one at a glance?
Two numbers on every row. The DitchCarbon score for the organisation, and the benchmark score for its industry. A score of 42 against a benchmark of 74 is an organisation well behind its peers, and a score of 98 against 97 is one already at the front. The gap is the signal.
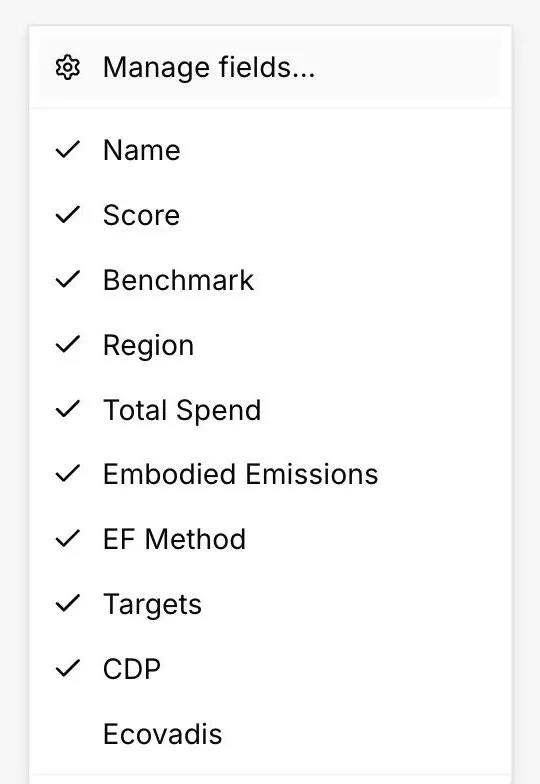
Configurable columns and custom fields
Can I track our own fields alongside the emissions data?
Yes. Every standard column can be shown or hidden, and custom fields can be added for the attributes a team already tracks, for example contract owner, tier or renewable electricity share. Custom fields appear in the table next to the emissions columns rather than in a separate system.
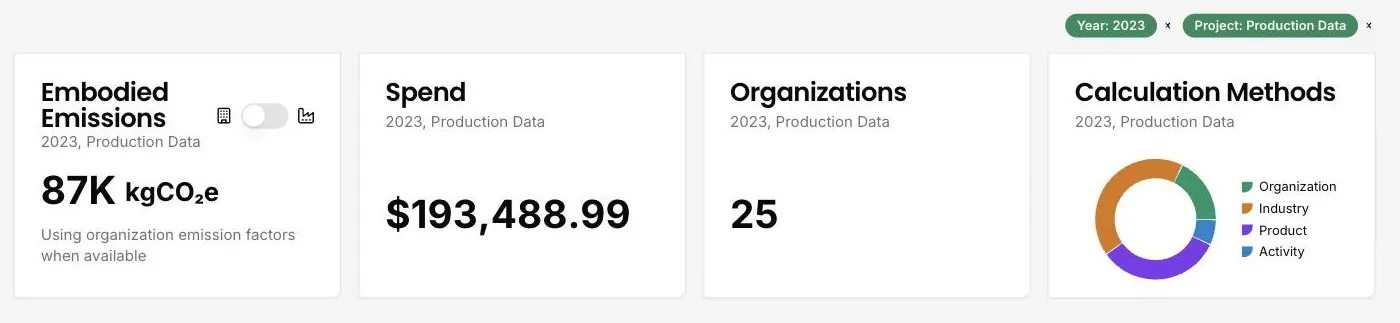
Year and project filtering
Can I see one reporting year or one part of the business on its own?
Every figure on the page narrows to a single reporting year, a single project, or both. One part of the business can be read against the whole without exporting anything, and the filter carries across every card and chart on the page rather than resetting per component.
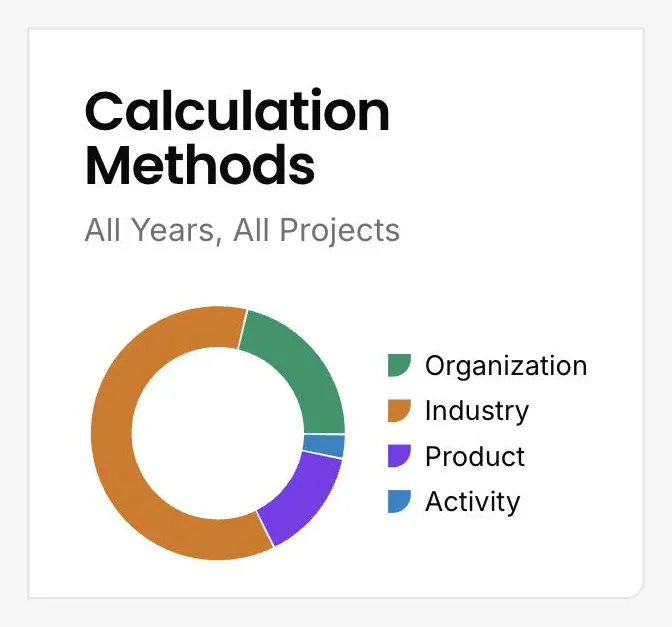
Calculation method breakdown
How do I show an auditor the data quality behind my Scope 3 number?
Every line in the baseline records the method used to calculate it. The breakdown groups those methods into organisation, industry, product and activity data, and shows each as a share of the total. Data quality becomes a proportion you can point at, rather than a claim you have to make.
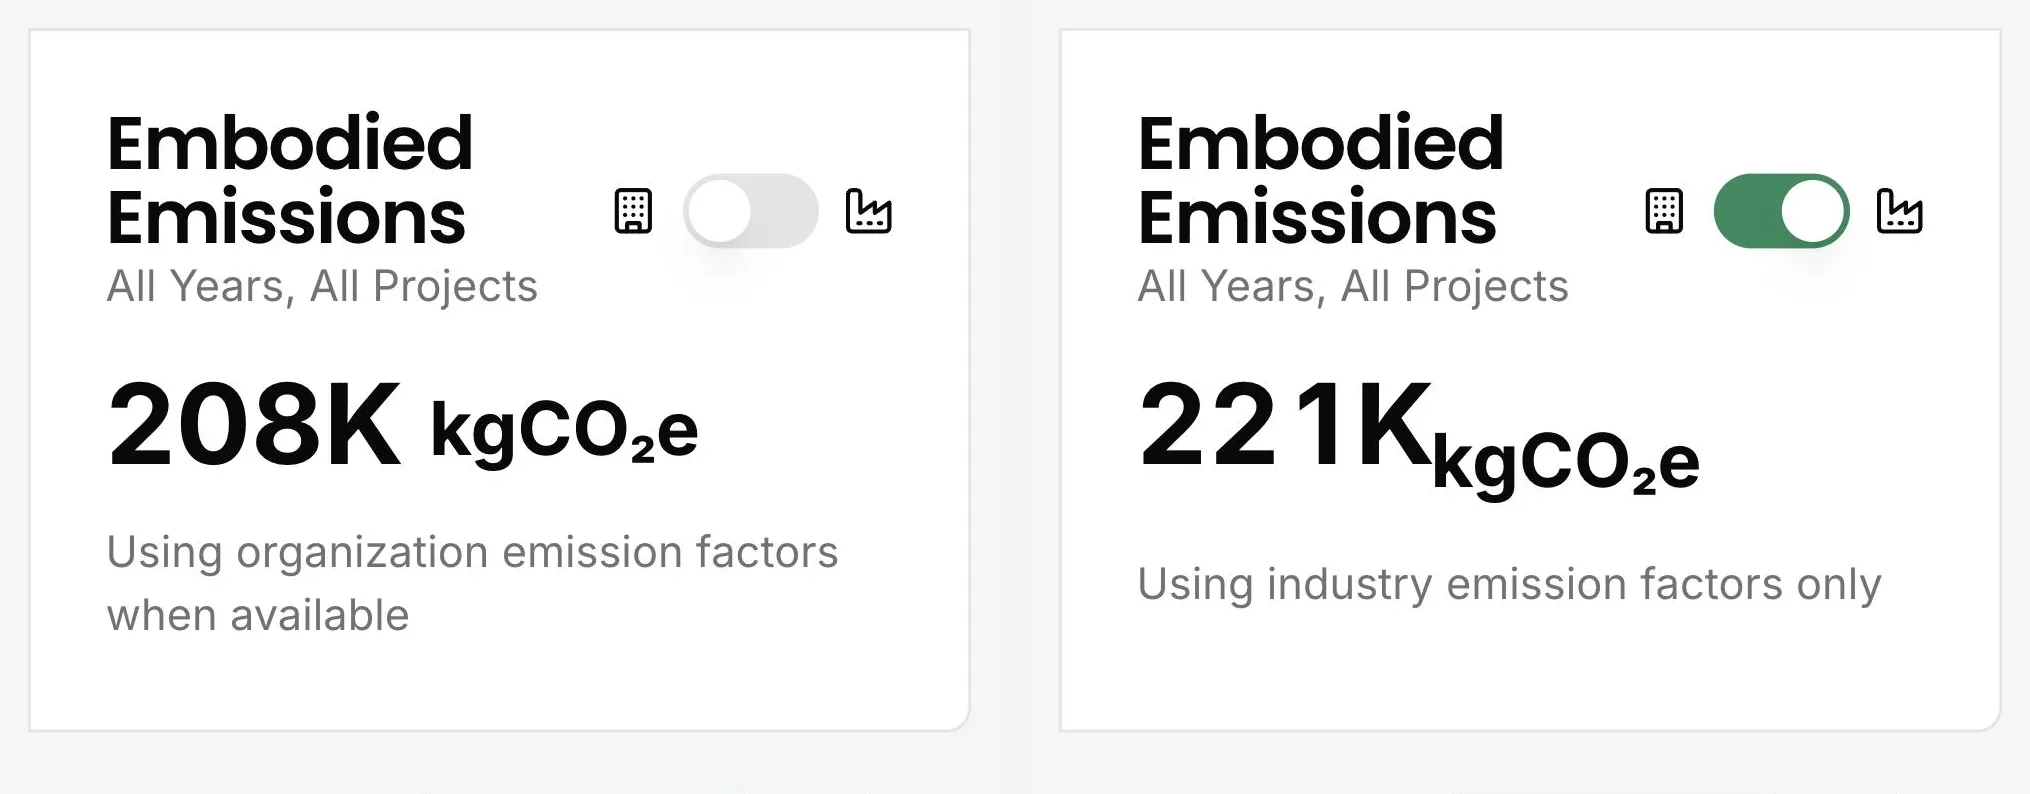
Organisation and industry factor comparison
How much of my Scope 3 baseline is primary data, my own or my suppliers' reported figures, and how much rests on a secondary, industry sector average?
One toggle answers it. Switch the headline emissions figure to industry emission factors only, then switch back to organisation emission factors where they exist. The difference between the two numbers is how much of your baseline rests on what organisations actually published, rather than on a sector average.
See it on your own suppliers, portfolio or profile
Numbers you can defend within 2 weeks, or one profile that answers every buyer asking.


