
.svg)

Counterparty emissions your auditor can trace to a source
A company-specific figure for the private and SME tail of your portfolio, mapped to the PCAF hierarchy, before you send a request.
For the holdings in your estimated tail, DitchCarbon holds verified emissions data for over 2 million organisations, built on primary emissions data wherever it exists, and shows which figures moved up the hierarchy and which are still modelled. Private companies included.
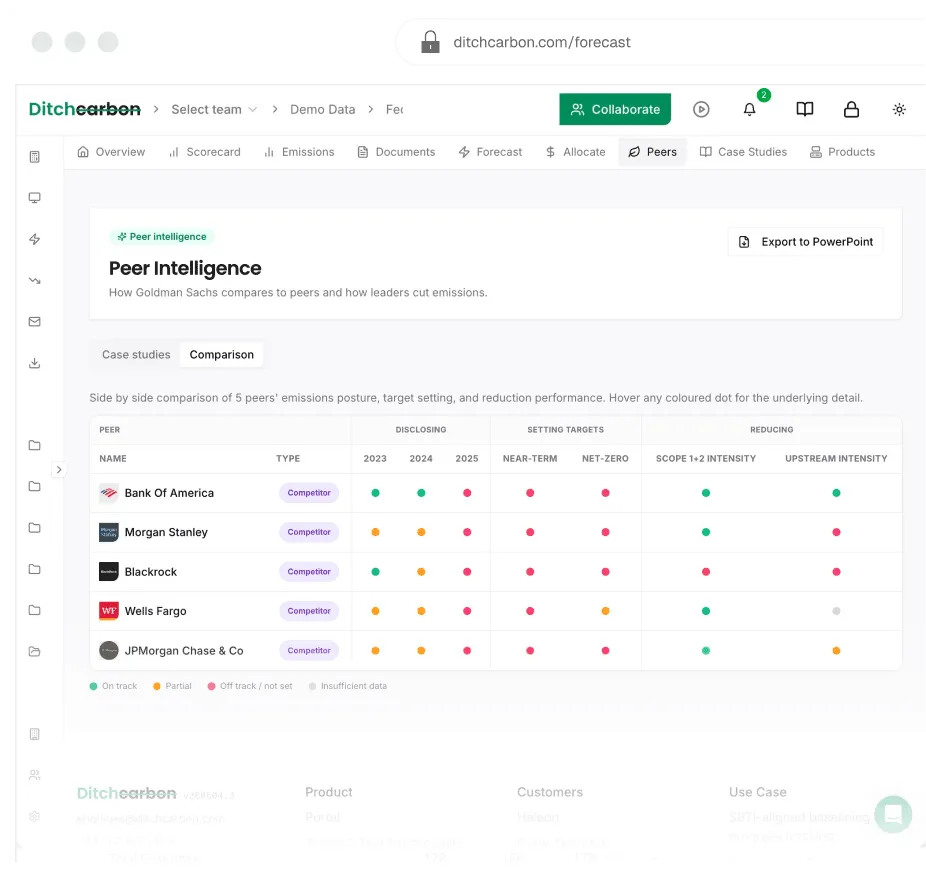

Over 2 million organisations, listed and private

Company-specific (primary) emissions at spend, activity and product level

Every figure carries its source and change history

Calculator verified to ISO 14064-3, limited assurance, by UL Solutions, renewed annually
Explore this use case
Where does the estimated tail in your portfolio come from?
Most of it is a sector factor with a counterparty's revenue attached. Where a company has not published an inventory, the standard fallback is an economic activity estimate: revenue or exposure multiplied by an average intensity for its sector and country. Under PCAF that is a data quality score of 4 or 5. Two SMEs in the same sector and country get the same intensity whatever they actually do, so the figure moves when your exposure moves and never when the company cuts its emissions.
The tail is also where the private companies sit. Listed issuers are covered by every data vendor. The lending book, the private equity holdings and the supplier base of a corporate client are not, and they are usually the largest share of the exposure. The result is a portfolio figure that is precise at the top and a black box at the bottom, refreshed once a year from a vendor file nobody can open.
DitchCarbon starts from the other end. For the counterparties that never disclosed to you, it finds what they disclosed to everyone else.

How much of your book already has a reported figure?
More than the vendor file suggests. A great many private companies publish an emissions figure somewhere: an annual report, a sustainability statement, a regulatory filing, a response to a customer. Those figures exist before you ask, and DitchCarbon has already found, matched and normalised them, with entity resolution against DUNS, LEI and ISIN identifiers so a counterparty in your book lands on the right record and the right parent.
The disclosure coverage view answers the question for the whole book at once: what proportion of your counterparties publish emissions data at all, hold Scope 1, 2 and 3 figures, and have set targets, each as a percentage of organisations. Each record then states which method produced its figure: the organisation's own reported inventory, product data from a published carbon footprint, activity data, or industry data where nothing better exists. Industry data is fourth of four. The method is a filterable column, and the portfolio total toggles between organisation-specific and industry factors, so the share of your book still resting on a sector average is a number on screen rather than a footnote.
That number is the test. Ask any provider to show that proportion on your own counterparties. A platform that cannot produce it is telling you something by not having it.

How does this fit the PCAF model you already run?
As a step up the hierarchy for the estimated tail, inside the approach you have. You keep your model, your factor set and your published targets. DitchCarbon supplies, per counterparty, the record that lets you move a line from an economic activity estimate to a reported figure: the figure itself, the source document behind it, its assurance level (verified, disclosed or estimated) and the data quality score that follows from it.
The fallback ladder is the one your model already uses, in your order. A disclosed figure first. Where there is none, a figure modelled from that company's own disclosures and its actual revenue rather than a sector guess. A regionalised industry factor last, and shown as such. The DQ 5 lines become DQ 4 lines; the counterparties that turn out to have published become DQ 2 or DQ 1, depending on whether their inventory was assured. Nothing is thrown away and the baseline does not jump.
What does your auditor see?
The document. Every figure on a DitchCarbon record links to the report it came from and carries its change history, including restatements merged into a single series. An auditor can sample a counterparty, open the source and see the same number. The data refreshes continuously as companies publish, with documented sources, so the figure you report in Q3 is not the one a vendor snapshotted last spring.
When the question turns to how the calculation itself can be relied on, the answer is a standard rather than a promise. The DitchCarbon calculator is verified to ISO 14064-3, limited assurance, by UL Solutions, renewed annually; DitchCarbon was the first company to earn UL Solutions' Sustainability Information Calculator Verification, June 2025. Data capture is annually assured by UL Solutions. DitchCarbon data has been used in emissions reports that were subsequently assured by ten different third-party assurance providers, including Big Four firms. The declarations are in the trust centre.
What happens with counterparties that have not disclosed?
You ask the ones worth asking, and you ask for less. From the portfolio view, a request goes to a counterparty prepopulated with what it has already published, so its team confirms and corrects rather than compiles. The four-step maturity ladder, sorted against embodied emissions, decides who is worth a request at all: the large, high-intensity counterparties still sitting on an industry factor, not the whole tail.
The counterparty gets something back. It answers once, on a profile it owns, and any bank or buyer that asks afterwards reads the same answer. That is the reason response rates on a prepopulated request run higher than on a blank questionnaire, and it is the reason a business customer will do it for you.
Where nothing has been published and nothing comes back, the line stays on a regionalised industry factor and the record says so. Coverage gaps shown, not hidden.
What can you do with the data after the baseline?
Act on the counterparties rather than report on the aggregate. Each organisation carries a forecast against its own target trajectory, aggregated to portfolio or sector level, so you can see where the book lands against your sector targets as well as where any one counterparty in it does. Targets register with SBTi-validated separated from self-declared. The 0 to 100 score carries a criterion-level breakdown; filter to the unearned criteria and the scorecard becomes an engagement list for the relationship managers.
The forecast is projection rather than measurement and carries a reliability notice where the underlying disclosure is thin. The UL Solutions verification covers the calculation, not the forecast, and the page says so.
How does it reach your systems?
In whatever form your model consumes. The platform for the team working the book, the API for the model that recalculates it, and a flat file for the reporting cycle, each carrying the same record, the same source link and the same data quality score. Entity resolution is done before delivery, so the file matches on your identifiers rather than on names.
Related articles



Frequently asked questions
Get answers to the questions climate-risk and sustainable-finance teams ask most often.
See the split on a sample of your counterparties
Send a representative sample of your book. What comes back: for each counterparty, whether a reported figure exists, where it sits in the PCAF hierarchy, and the document behind it.

