.svg)
Spend under measurement
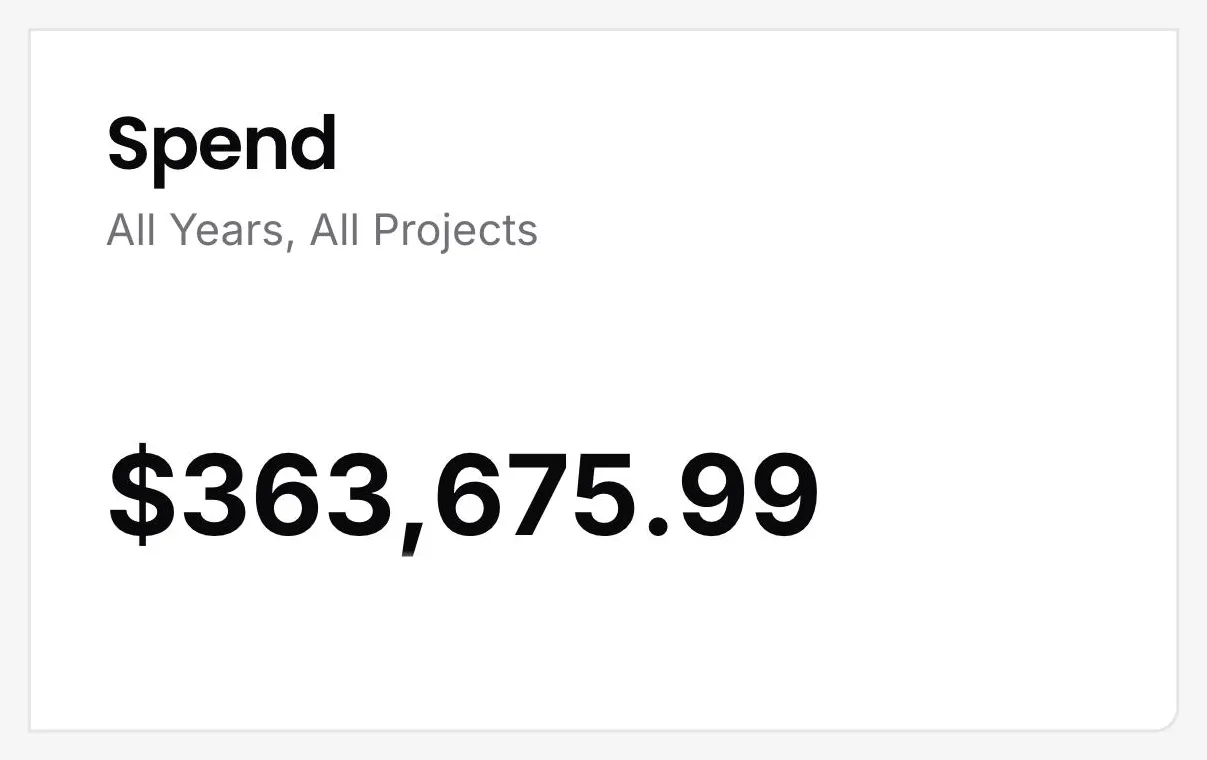
DitchCarbon shows the total spend behind a Scope 3 baseline, so the figure can be read against the spend it was calculated from.
How much of my spend is behind this number?
The spend total sits next to the emissions total, on the same filters. Reading the two together is what makes an intensity figure possible, and it is the first check on whether a baseline covers the spend a team thought it covered.
Common questions
Why show spend beside emissions?
What does spend under measurement mean?
Available plans
Collect + calculate
Analyse
Action
Status
Live
Last reviewed
September 17, 2026
Documentation
Reference :
Spend under measurement
See it on your own suppliers, portfolio or profile
Numbers you can defend within 2 weeks, or one profile that answers every buyer asking.


v260319.2
