.svg)
Organisation profile
Where do I see everything we know about one supplier?
One page per organisation, reached from any row in the table. Reported emissions by scope, the score and how it was built, climate goals and progress against them, industry intensity, peers, products and the documents every figure came from. Nothing has to be assembled by hand.
A portfolio view answers how big the number is. It does not answer why one organisation sits where it does, and that is the question a category manager arrives with before a supplier conversation.
The profile exists so that answer is one page rather than a research task. Every figure on it carries its source and change history, so a claim made in a supplier meeting can be traced back to the document it came from while the meeting is still happening.
It reads the same way whether the organisation is a supplier or a portfolio company, because the underlying data is the same verified layer either way.
Can I see the document a supplier's emissions figure came from, and how far it was assured?
Who do I actually contact about emissions at this supplier?
What has this supplier already done to cut its emissions?
What should I actually ask this supplier to do?
Which Scope 3 categories has this supplier actually disclosed?
How much of this supplier's footprint is Scope 3?
Is this a high carbon industry, and is it getting better?
Has this supplier's footprint gone up or down over time?
Which climate initiatives has this supplier actually joined?
How is this supplier's scorecard actually calculated?
Is this supplier actually on track for the target it announced?
Can I use product carbon footprint (primary data)s for part of my spend and averages for the rest?
Where do I find a product carbon footprint (primary data) for something I buy?
How do I compare a supplier's emissions across years when they keep restating them?
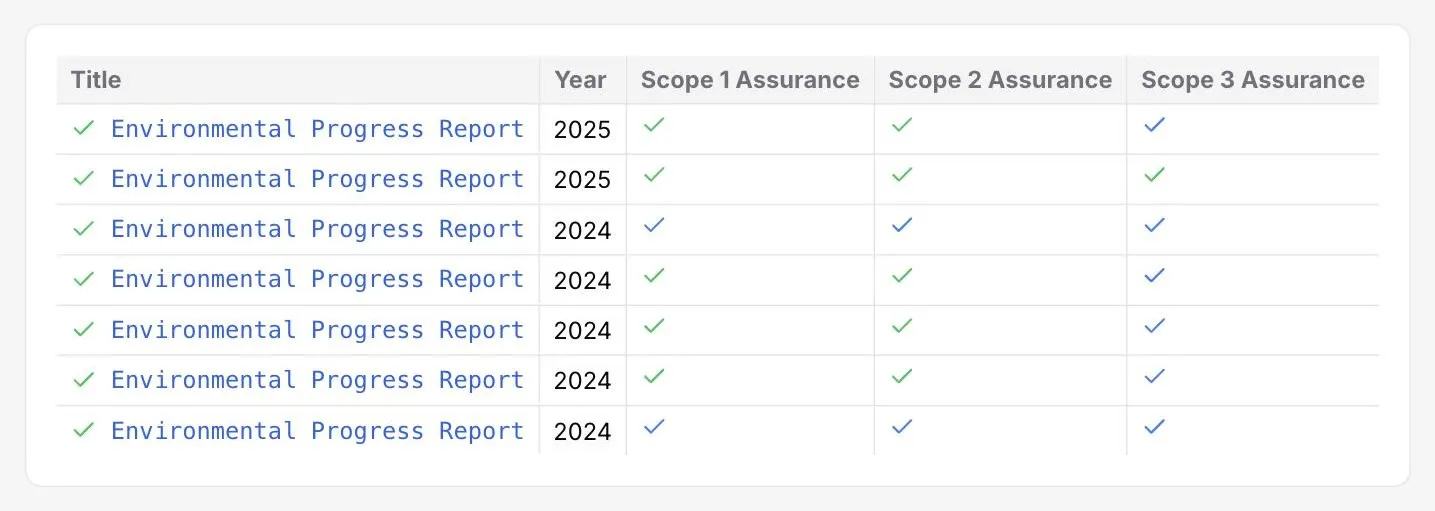
Source document library with assurance status
Can I see the document a supplier's emissions figure came from, and how far it was assured?
Yes, and how far it was assured. Every document is listed with its year and three assurance columns, one per scope. Each cell states the level of assurance (reasonable, limited, unspecified or none), the scope it covers and the assurance provider the document names, with the assurance statement quoted, so you read the evidence rather than a tick.

Named sustainability contacts
Who do I actually contact about emissions at this supplier?
The organisation's page names them, with job titles, so a request goes to the person who owns the data rather than to a generic procurement address. It is the difference between a question that gets answered and one that gets forwarded twice and then dropped.
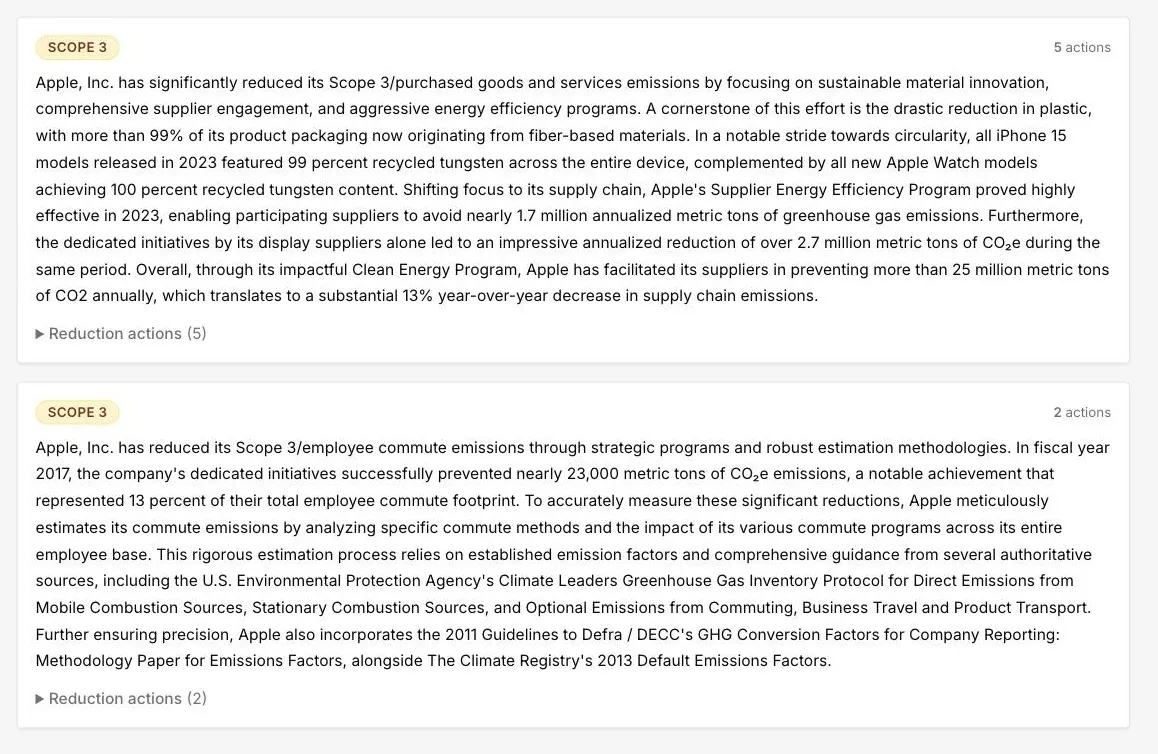
Reduction case studies from published reports
What has this supplier already done to cut its emissions?
Read it per scope. Each case study describes what an organisation actually did, drawn from its own published reports, and lists the individual reduction actions behind it, each rated high, medium or low for impact and linked to the sentence in the source document. It covers what worked, with the organisation's own figures, rather than a statement of intent.
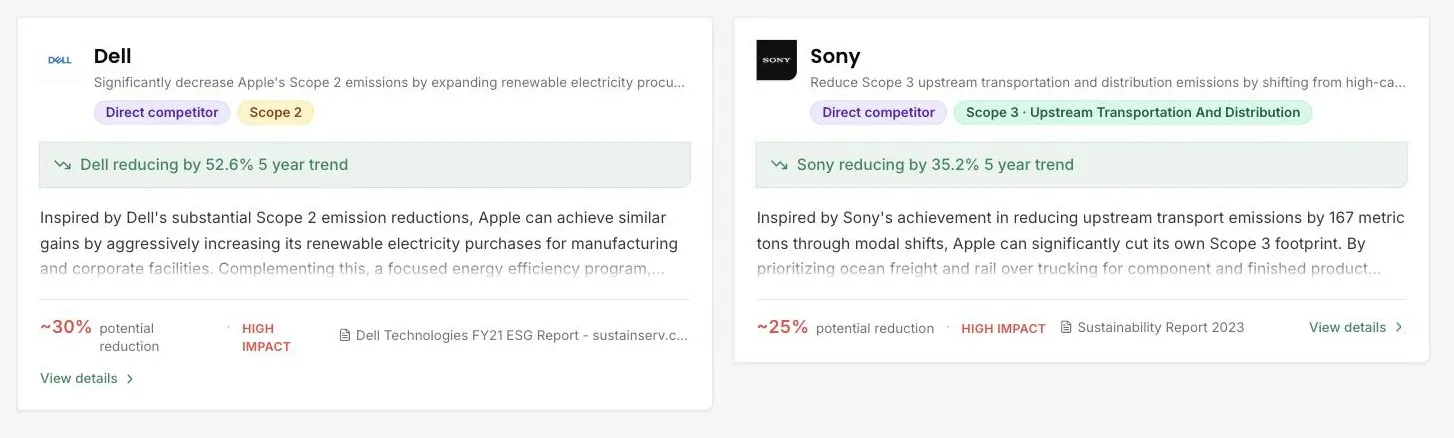
Peer intelligence
What should I actually ask this supplier to do?
Ask for what a peer already did. Each recommendation names a comparable organisation, the scope or Scope 3 category it cut, the reduction it achieved on a two or five year trend, and the specific action behind it, with an estimated reduction and an impact rating for the organisation in front of you.
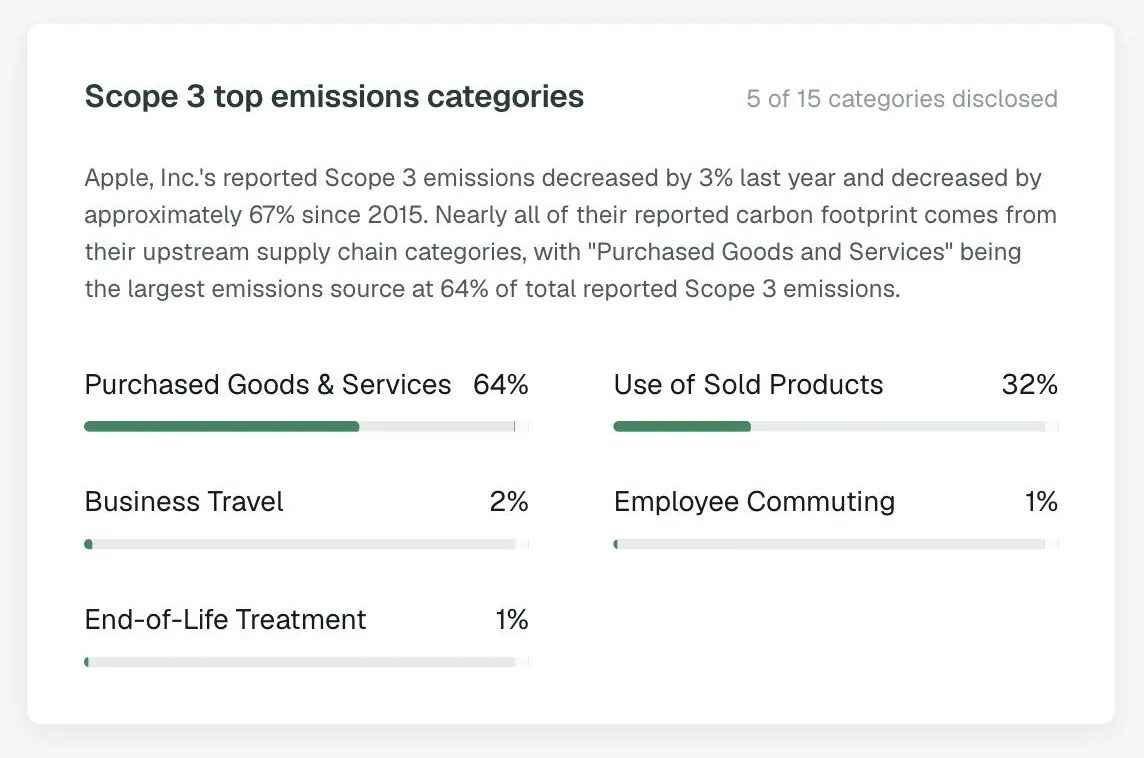
Scope 3 category breakdown
Which Scope 3 categories has this supplier actually disclosed?
The breakdown ranks the disclosed categories by share of the reported Scope 3 total, and states the count, for example five of fifteen categories disclosed. The count is the important half: a clean-looking split across five categories says nothing about the ten that were never reported.
Scope 1, 2 and 3 split
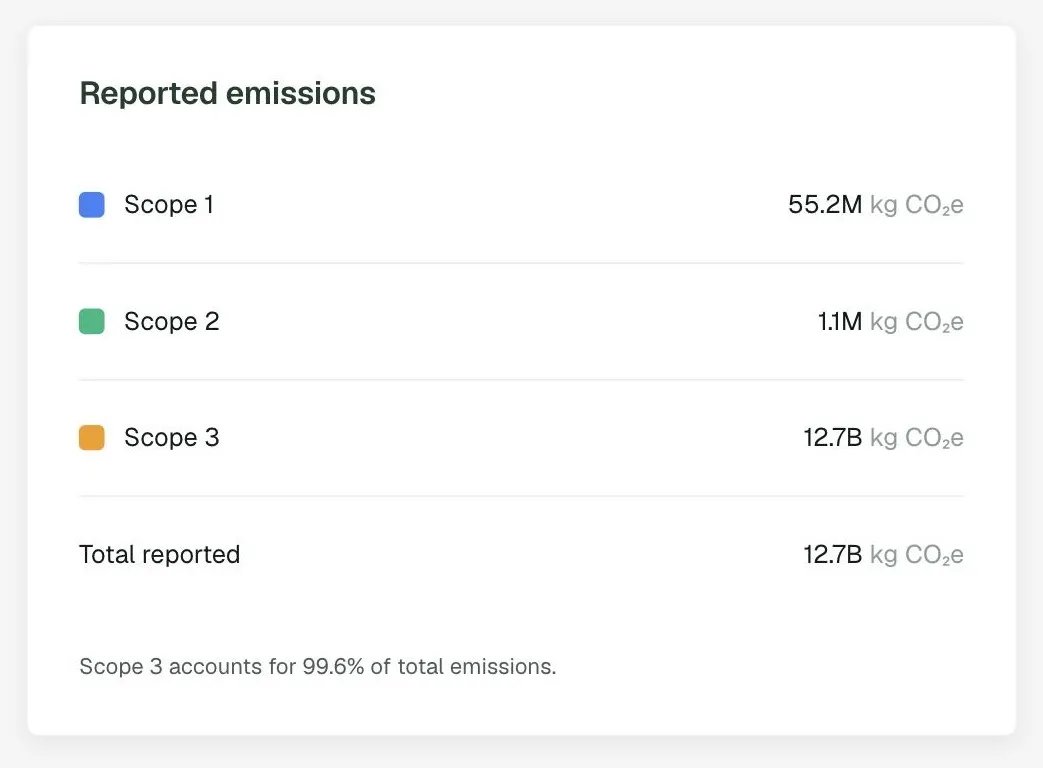
How much of this supplier's footprint is Scope 3?
Usually almost all of it, and the split says exactly how much. Scope 1, Scope 2 and Scope 3 are listed with the reported total and the percentage Scope 3 accounts for. An organisation reporting Scope 1 and 2 only is visible immediately as an incomplete picture.
Industry intensity and sector trend
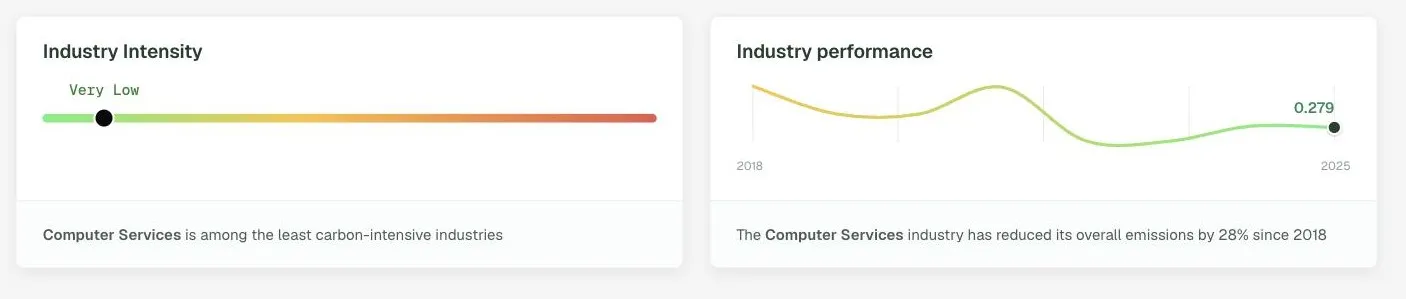
Is this a high carbon industry, and is it getting better?
Two readings side by side. The intensity band places the organisation's sector from very low to very high, and the trend line shows how that sector's emissions have moved since 2018. A low intensity sector moving the wrong way is a different conversation from a heavy sector improving fast.
Emissions trajectory since 2011
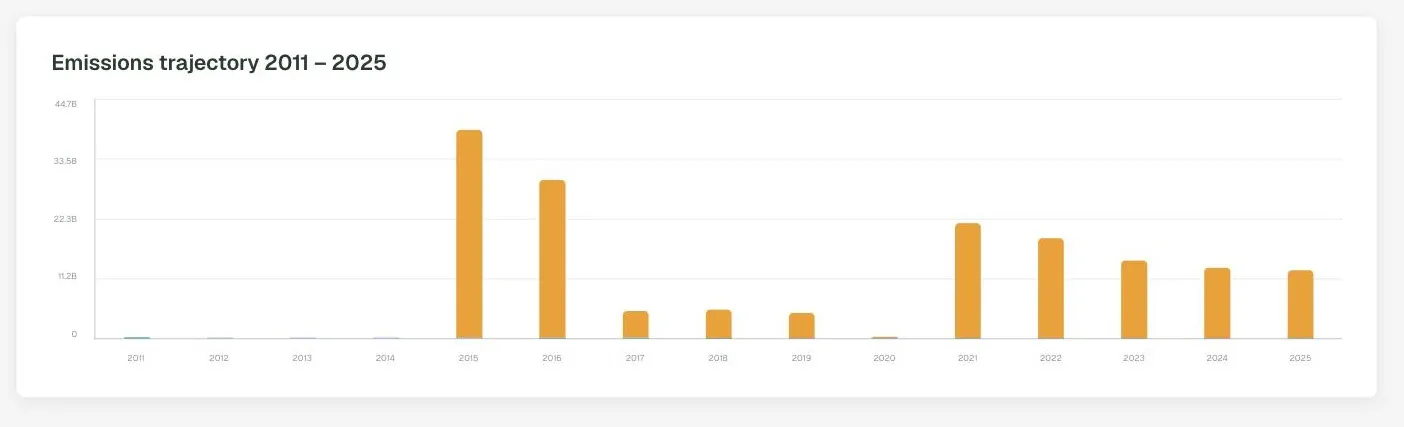
Has this supplier's footprint gone up or down over time?
A fifteen year bar chart of total reported emissions, from 2011 to the current year. Gaps are shown as gaps rather than interpolated, so a missing year reads as an organisation that did not report rather than one that emitted nothing.
Climate initiative membership
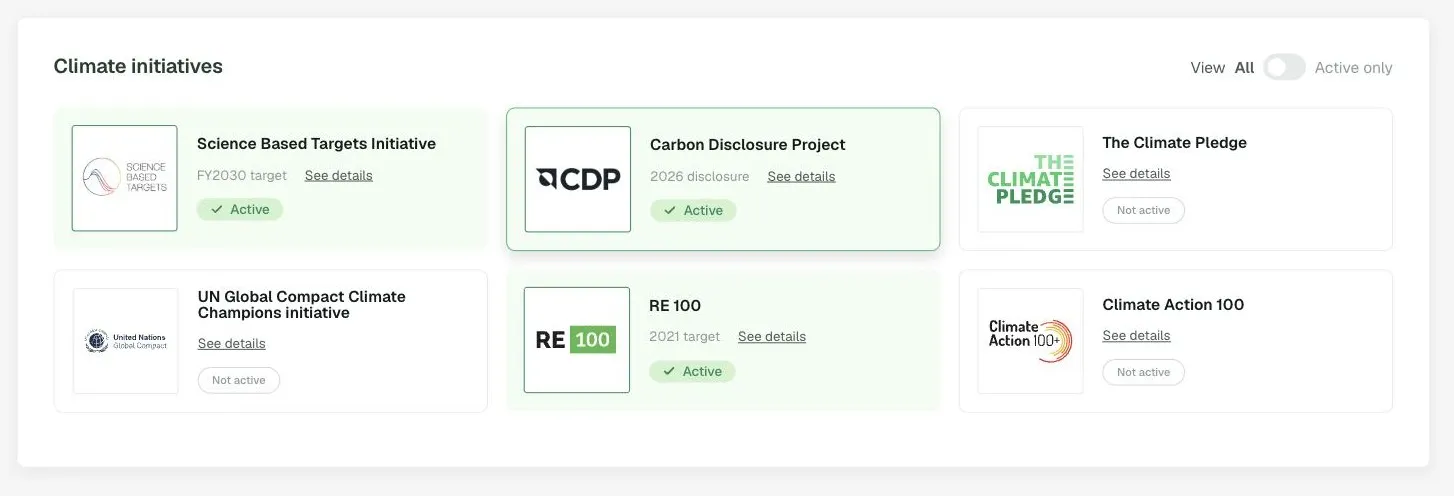
Which climate initiatives has this supplier actually joined?
Each initiative is listed with its status, active or not active, and the target or disclosure year where one applies. Coverage spans the Science Based Targets initiative, CDP, The Climate Pledge, the UN Global Compact, RE100 and Climate Action 100. Filter to active memberships only.
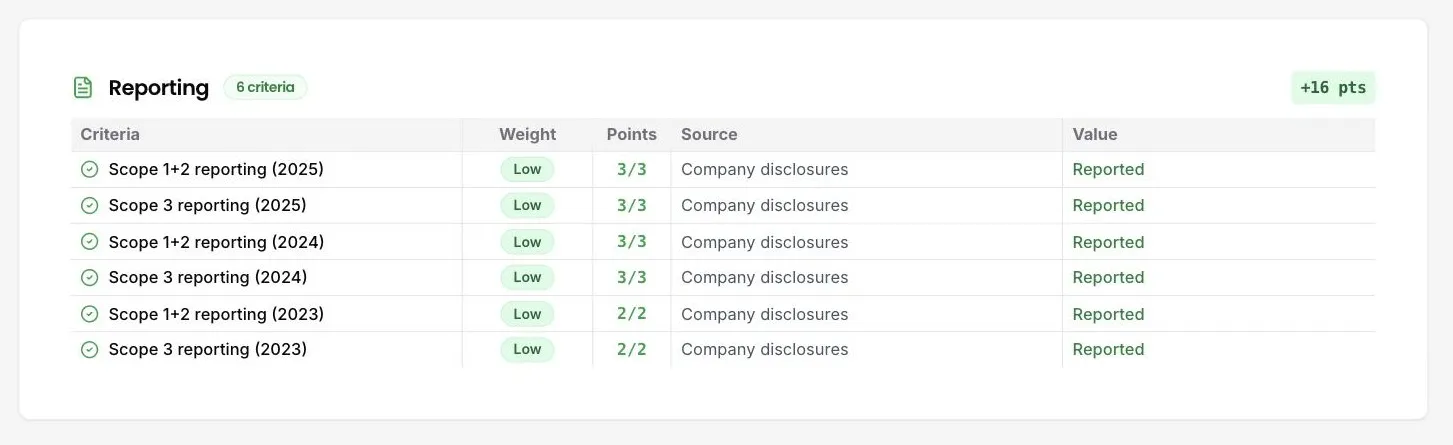
Transparent scorecard breakdown
How is this supplier's scorecard actually calculated?
Criterion by criterion. Six groups cover industry, region, reporting, initiatives, reductions and reporting quality. Each row names the criterion, its weight, the points earned out of those available, the source consulted and the value found, for example a CDP database check returning disclosed. Filter to earned or unearned criteria.
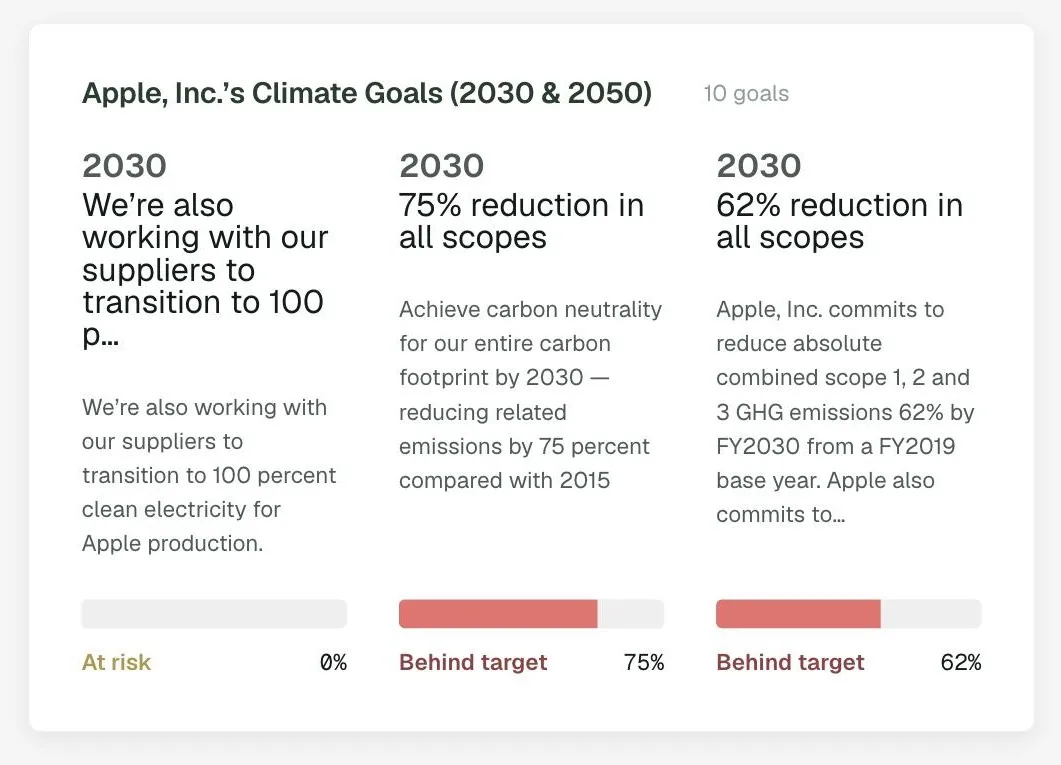
Climate goals tracked against progress
Is this supplier actually on track for the target it announced?
Each published goal is held with its target year, its stated reduction and a status drawn from the organisation's own reported emissions, which is primary data under the GHG Protocol: behind target, at risk, or on track. The goal text is quoted verbatim from the document it came from, so the commitment being measured is the one the organisation made.
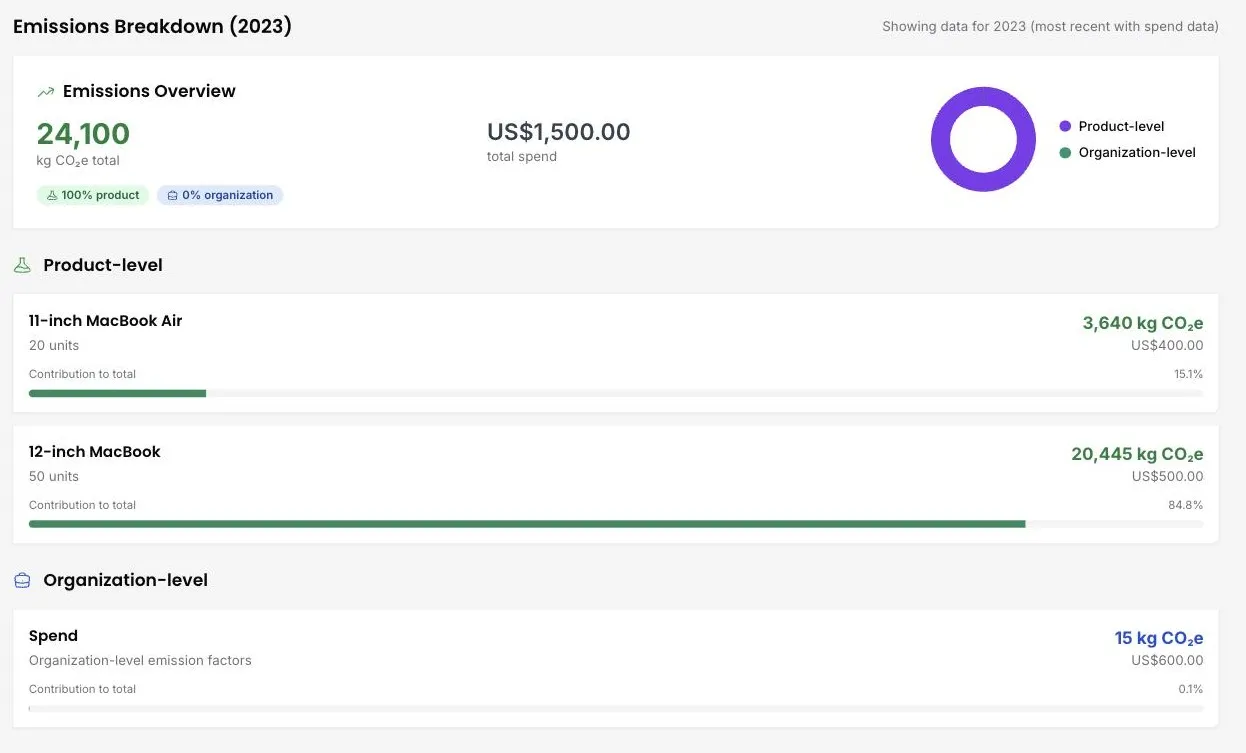
Spend allocation across products and organisation
Can I use product carbon footprint (primary data)s for part of my spend and averages for the rest?
Yes, on the same organisation. Allocate spend to named products and DitchCarbon uses each product's own published footprint, then calculates whatever is left on the organisation emission factor. Each line shows units, kgCO2e, spend and its share of the total, so the two methods are visible side by side.
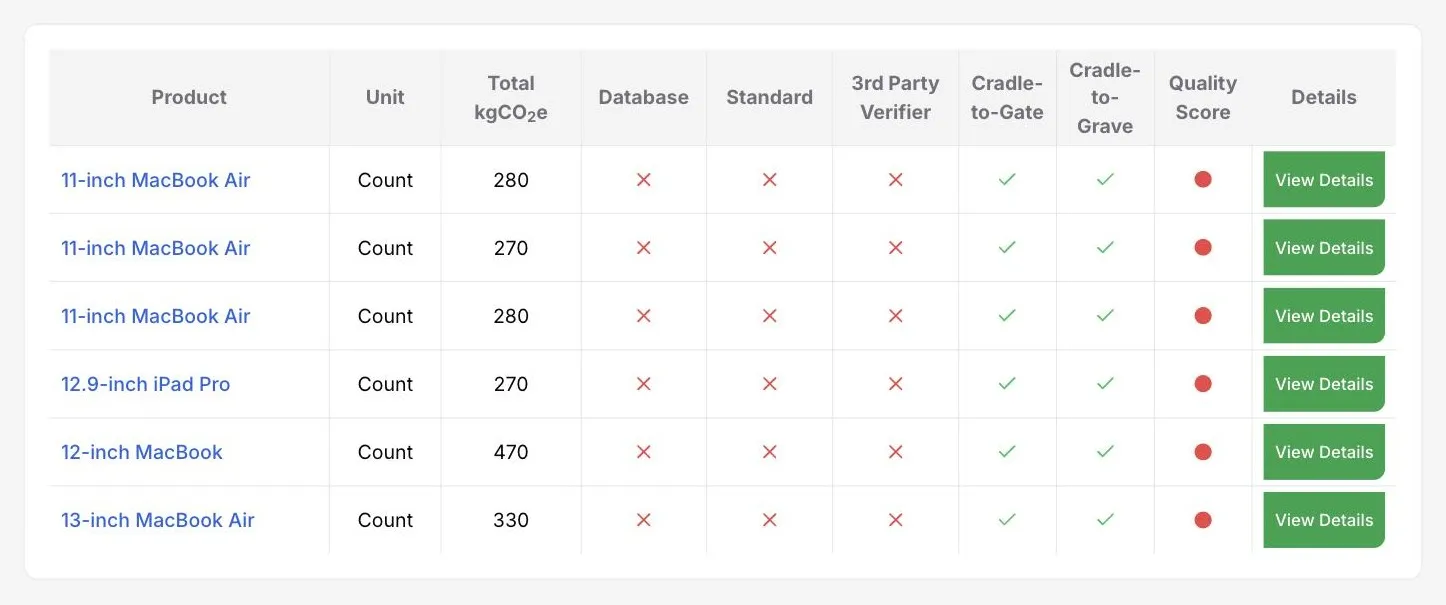
Product carbon footprint library
Where do I find a product carbon footprint (primary data) for something I buy?
On the organisation's own page. Each product row carries its total kgCO2e per unit, the standard it was prepared to, the third-party verifier if there is one, whether the boundary is cradle to gate or cradle to grave, and a quality score. Filter by product name to find a specific model.
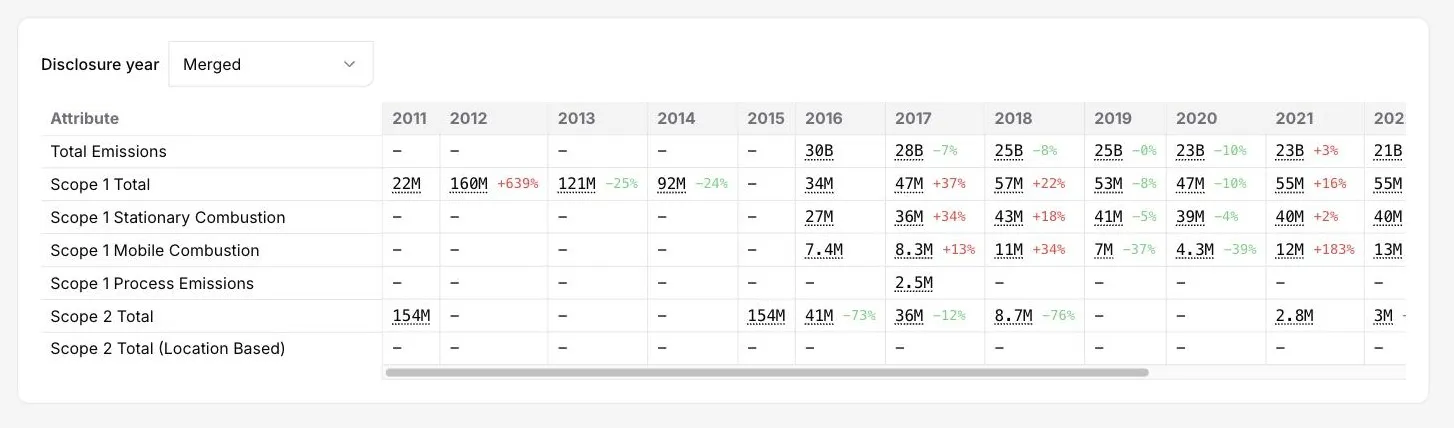
Fifteen years of emissions history with restatements
How do I compare a supplier's emissions across years when they keep restating them?
The history is held per attribute per year, eighteen attributes deep, from Scope 1 combustion through each disclosed Scope 3 category. Every cell shows the change against the prior year. Where an organisation has restated, the disclosure years are merged into one series rather than left as competing versions.
See it on your own suppliers, portfolio or profile
Numbers you can defend within 2 weeks, or one profile that answers every buyer asking.


