.svg)
Fifteen years of emissions history with restatements
DitchCarbon holds an organisation's reported emissions year by year from 2011, across eighteen attributes including every disclosed Scope 3 category, with the change against the prior year on each figure.
The history is held per attribute per year, eighteen attributes deep, from Scope 1 combustion through each disclosed Scope 3 category. Every cell shows the change against the prior year. Where an organisation has restated, the disclosure years are merged into one series rather than left as competing versions.
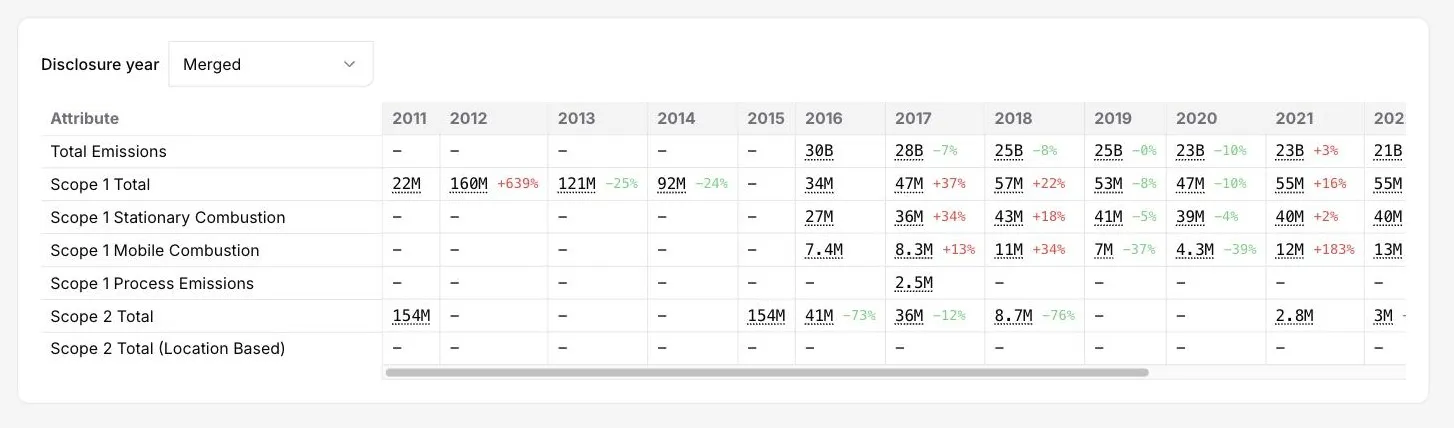
Organisations restate. A figure published in one annual report reappears in the next with a different value and no explanation, and a year on year comparison built from two reports is comparing two methodologies.
The merged view resolves that into a single series, so a trend line means what it appears to mean. Individual disclosure years remain selectable when you need to see what was published at the time rather than the reconciled version.
Emission factors are plotted alongside the absolute figures: the organisation's own factor, its upstream factor, its Scope 1 and 2 factor, and the industry factor for its region. An absolute number falling while the factor rises is a smaller organisation rather than a cleaner one, and the two series together say which.
Every figure carries its source and change history, so any cell can be followed back to the document it came from.
Common questions

See it on your own suppliers, portfolio or profile
Numbers you can defend within 2 weeks, or one profile that answers every buyer asking.


