.svg)
Product carbon footprint library
DitchCarbon holds published product carbon footprints (primary data) for an organisation's products, each with the standard it was prepared to, its third-party verifier, whether it is cradle to gate or cradle to grave, and a data quality score.
On the organisation's own page. Each product row carries its total kgCO2e per unit, the standard it was prepared to, the third-party verifier if there is one, whether the boundary is cradle to gate or cradle to grave, and a quality score. Filter by product name to find a specific model.
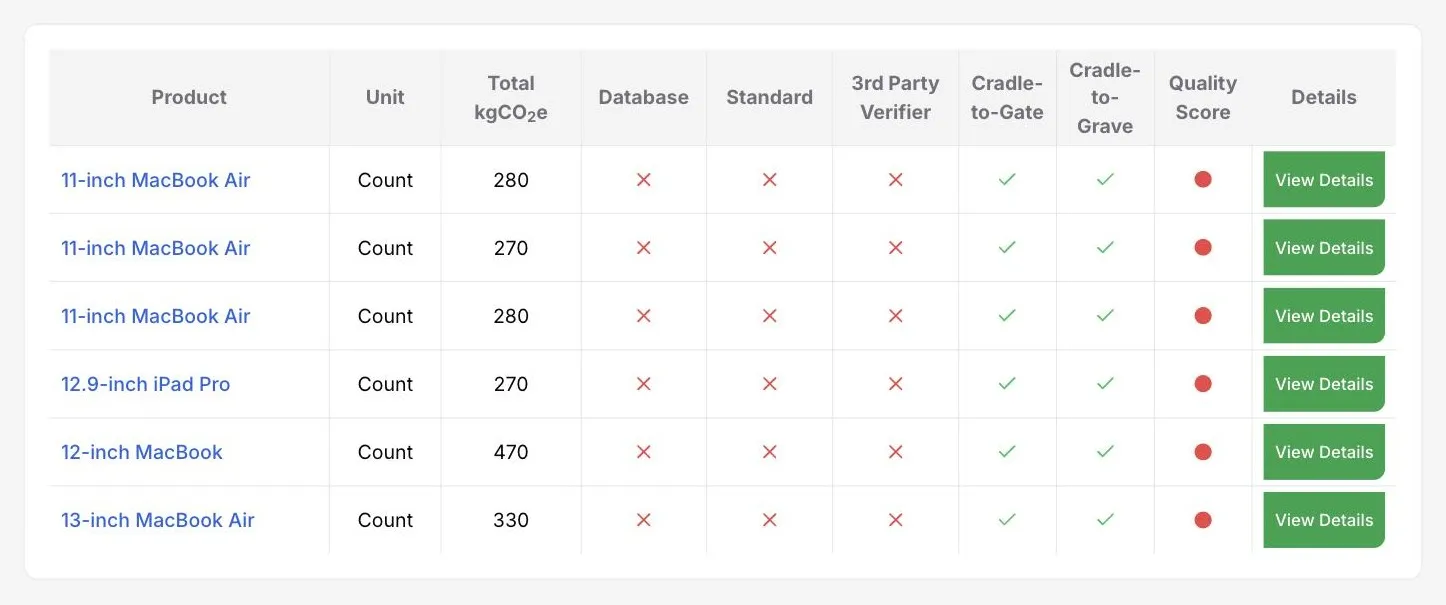
A product carbon footprint is only usable if you know what it covers. A cradle to gate figure and a cradle to grave figure for the same item are different numbers answering different questions, and mixing them quietly corrupts a category total.
Every row states its boundary, so the comparison is explicit. Rows also state the standard behind the figure, for example ISO 14044 and ISO 14067, and name the third-party verifier where the footprint was verified.
The quality score is the fastest read. A footprint with a standard, a verifier and a stated boundary scores differently from a bare number lifted out of a marketing page, and the score says which you are looking at before you use it.
Open a footprint and it decomposes further. A lifecycle breakdown splits the total across manufacturing, transport, use and end of life, and the phases below it follow the EN 15804 modules: A1 to A3 for manufacturing, B1 to B7 for use, C1 to C4 for end of life, and D beyond the system boundary. The stored source document is linked from the same panel, so the figure and its evidence stay together.
Where a product footprint exists for something you actually buy, it feeds the calculation directly through spend allocation rather than sitting in a separate library.
Common questions

See it on your own suppliers, portfolio or profile
Numbers you can defend within 2 weeks, or one profile that answers every buyer asking.


