.svg)
DitchCarbon score against the industry benchmark
DitchCarbon scores every organisation from 0 to 100 and shows the industry benchmark next to it, so a score reads as a position against sector peers rather than a number on its own.
Two numbers on every row. The DitchCarbon score for the organisation, and the benchmark score for its industry. A score of 42 against a benchmark of 74 is an organisation well behind its peers, and a score of 98 against 97 is one already at the front. The gap is the signal.
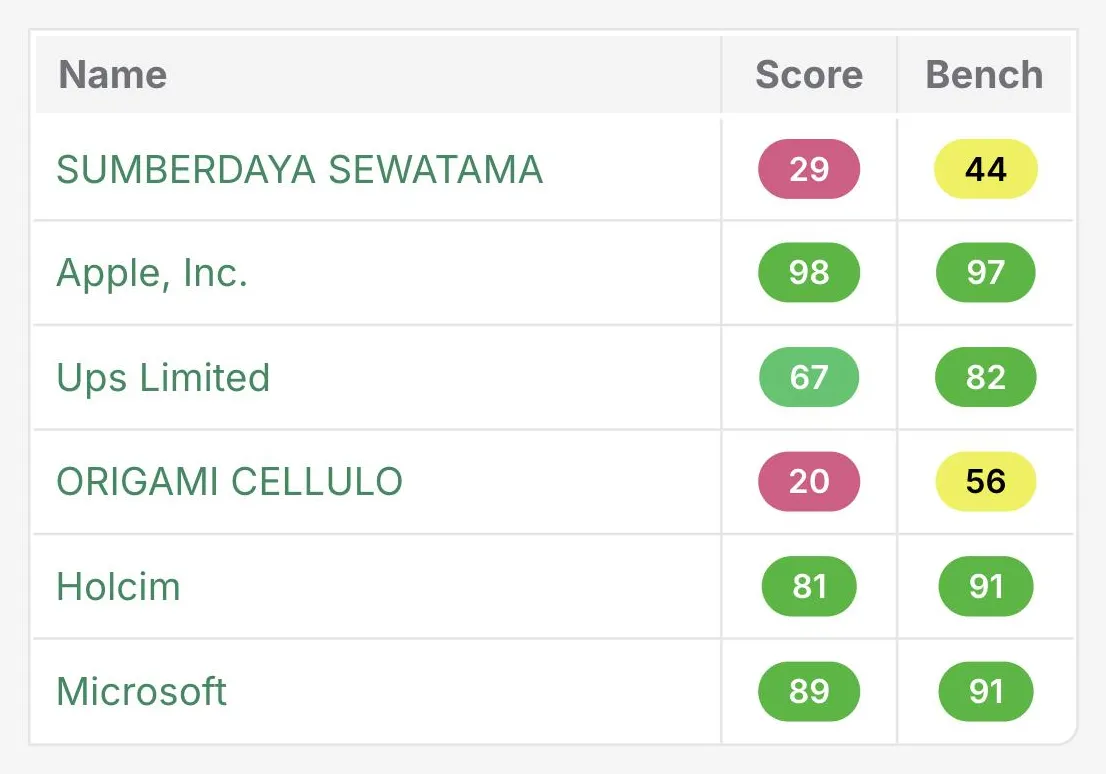
A score without a scale is a number nobody can act on. The benchmark supplies the scale, drawn from peers in the same industry, so the comparison is like for like rather than a global average.
The score itself is built from emissions intensity, disclosure quality, climate commitments including validated science-based targets and CDP responses, and the direction of travel over time. The published methodology sets out the inputs and the weightings.
On an organisation's own page the same comparison is stated in words, for example a score higher than 100% of its industry, which is the form that survives being quoted into a QBR pack.
Common questions

See it on your own suppliers, portfolio or profile
Numbers you can defend within 2 weeks, or one profile that answers every buyer asking.


