coverage check

Check your coverage

Send us a supplier list or portfolio and we'll come back with your coverage report: what we hold on every organisation in it, gaps included.

DitchCarbon provides verified emissions data for over 2 million organisations, built on primary emissions data wherever it exists, so procurement, sustainability and finance teams can measure and act on supply chain and portfolio emissions from one source.


Three steps to your coverage report

01
Send your list
A CSV is enough. No list to hand? We'll build a first view from what we already hold.

02

We match it
Entity resolution against DUNS, LEI and ISIN identifiers, so subsidiaries and parents resolve correctly.

03

Get your coverage report
Every figure carries its source and change history, and coverage gaps are shown, not hidden.

Numbers you can defend within 2 weeks. A recent deployment reached about 60% of a large supplier base within 2 weeks.

Get your coverage report

Tell us what you're assessing and we'll run the check. The report is free.

What we hold on every organisation in your list
Gaps included, so you know what's missing before an auditor asks
Sources and change history behind every figure
Attach your list
Uploading...
fileuploaded.jpg
Upload failed. Max size for files is 10 MB.
Thanks, we've got it. We'll reply by email, or pick a time now if you'd rather talk it through.
Oops! Something went wrong while submitting the form.
The data behind the report

Explore company emissions profiles

The same records your report draws on, for the organisations you buy from or invest in.

Sample Company A
Consumer goods · Listed
Scope 1+2
412 ktCO₂e
Scope 3
5,930 ktCO₂e
Source
Annual report
DQ 2
Sample Company B
Industrials · Private
Scope 1+2
88 ktCO₂e
Scope 3
1,140 ktCO₂e
Source
Modelled + filings
DQ 3
Sample Company C
Consumer goods · Listed
Scope 1+2
203 ktCO₂e
Scope 3
2,470 ktCO₂e
Source
CDP response
DQ 1
Forecast

See where each organisation is heading

Forecasting and scenario planning for the organisations you buy from or invest in, built on the same data as your coverage report.
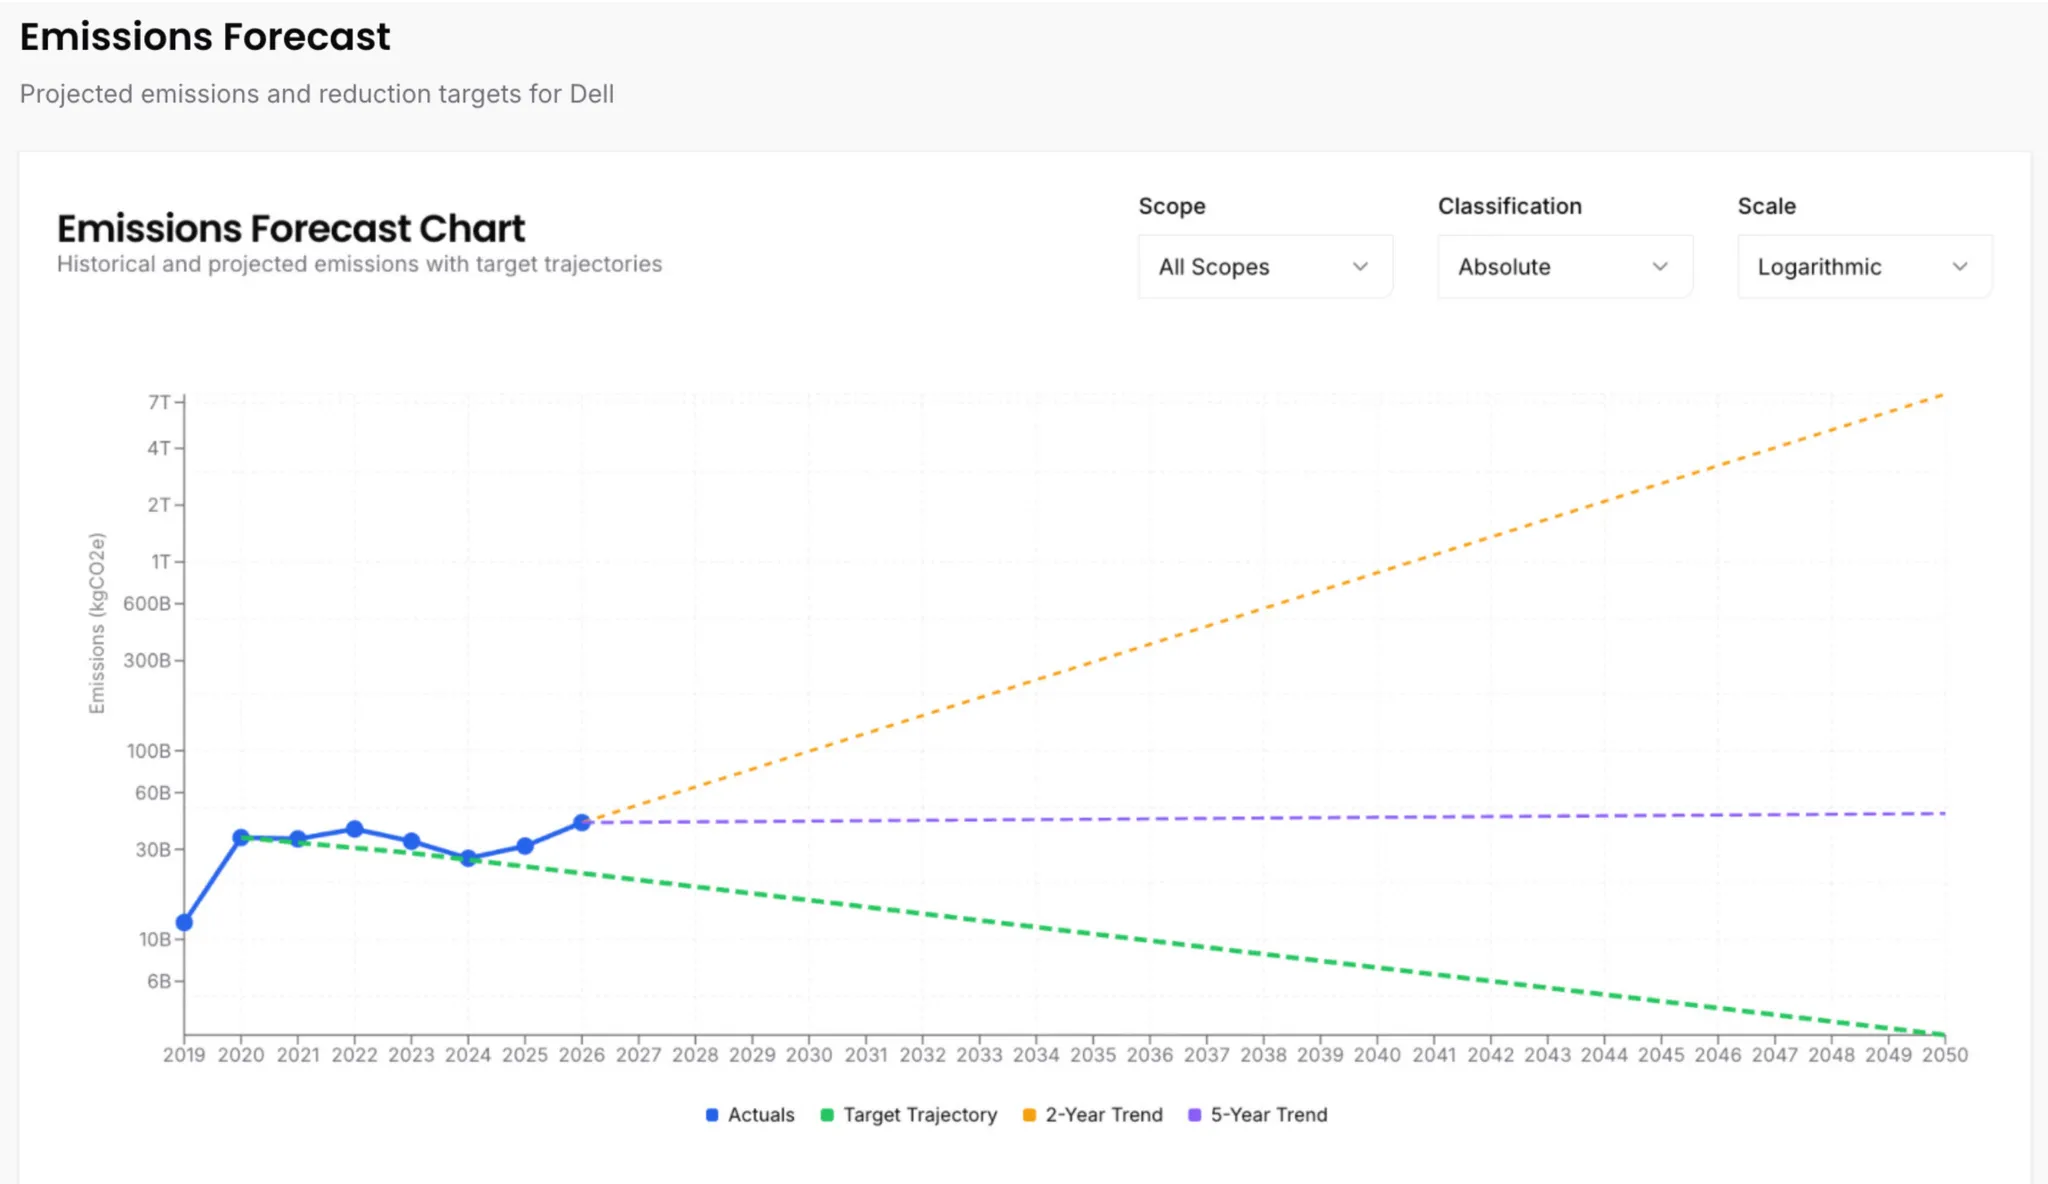
DitchCarbon platform screen showing an Emissions Forecast Chart of actual emissions with target trajectory and 3- and 5-year trend lines to 2050
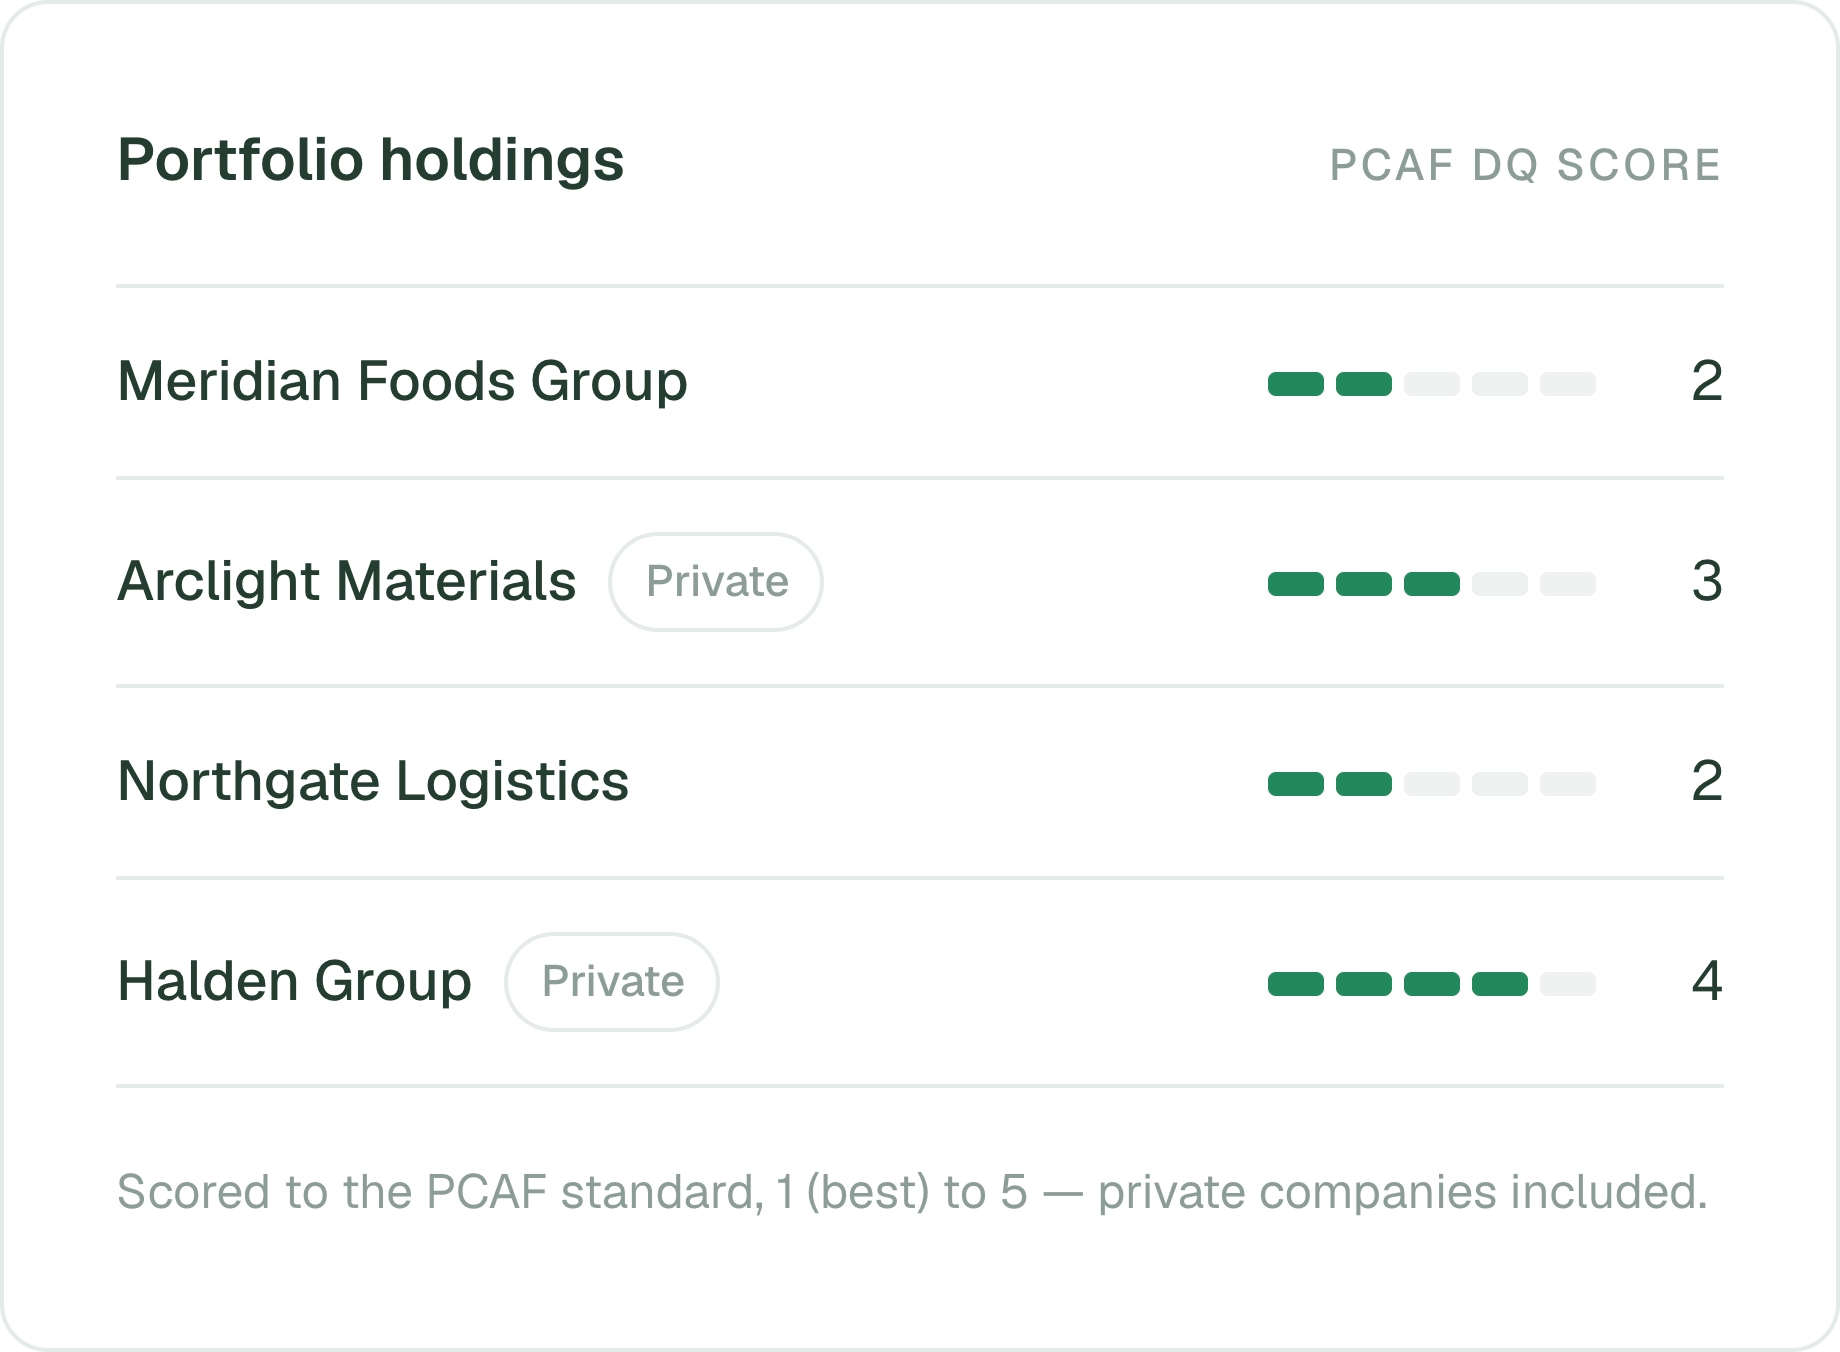
DitchCarbon platform screen showing portfolio holdings with PCAF data quality scores from 1 (best) to 5, including private companies
Portfolios

Need PCAF data quality scores for a portfolio?

Every organisation carries a PCAF data quality score (usually shortened to DQ score), including private companies, so DQ 4 and 5 holdings stop being blind spots. Portfolio and counterparty coverage runs on the same layer as supplier coverage.

What does the data look like?

Open an example company to see what a record holds: Scope 1, 2 and 3 emissions, climate targets and whether the organisation is on track, third-party assurance status, and the initiatives it has signed up to. Your coverage report is built from the same records.


Accenture logoChanel logoFrieslandCampina logoBioNTech logoAB InBev logo
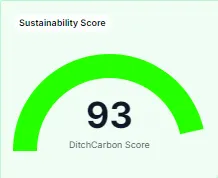
DitchCarbon platform card showing a Sustainability Score gauge with a DitchCarbon score of 93
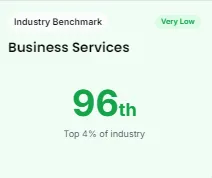
DitchCarbon platform card showing an Industry Benchmark for Business Services: 96th, top 4% of industry, rated Very Low
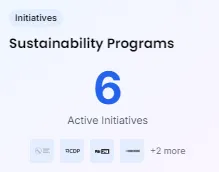
DitchCarbon platform card showing Sustainability Programs: 6 active initiatives
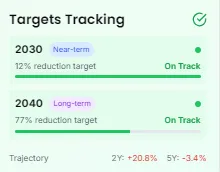
DitchCarbon platform card showing Targets Tracking: 2030 near-term 12% reduction target and 2040 long-term 77% reduction target, both on track
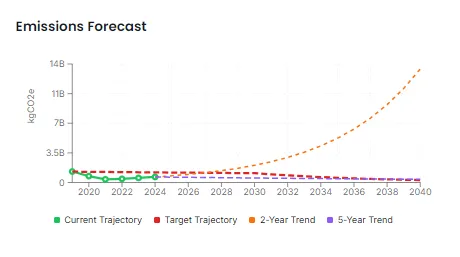
DitchCarbon platform Emissions Forecast chart from 2020 to 2040, comparing current trajectory, target trajectory, 2-year and 5-year trends
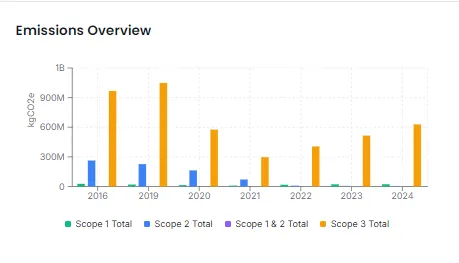
DitchCarbon platform Emissions Overview bar chart of Scope 1, Scope 2 and Scope 3 totals from 2016 to 2024, with Scope 3 largest
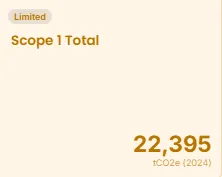
DitchCarbon platform card showing Scope 1 Total: 22,395 tCO2e (2024), marked Limited
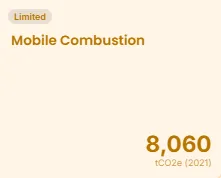
DitchCarbon platform card showing Mobile Combustion: 8,060 tCO2e (2021), marked Limited
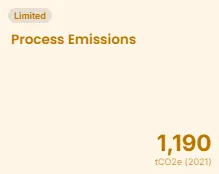
DitchCarbon platform card showing Process Emissions: 1,190 tCO2e (2021), marked Limited
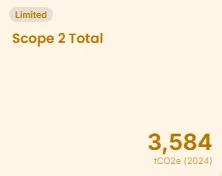
DitchCarbon platform card showing Scope 2 Total: 3,584 tCO2e (2024), marked Limited
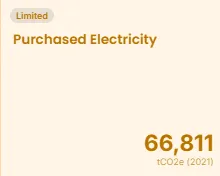
DitchCarbon platform card showing Purchased Electricity: 66,811 tCO2e (2021), marked Limited
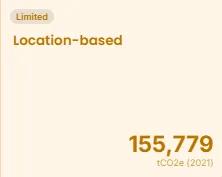
DitchCarbon platform card showing Location-based: 155,779 tCO2e (2021), marked Limited
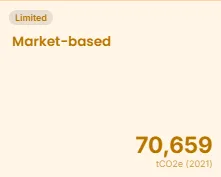
DitchCarbon platform card showing Market-based: 70,659 tCO2e (2021), marked Limited
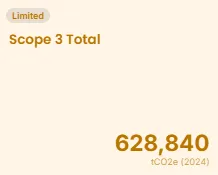
DitchCarbon platform card showing Scope 3 Total: 628,840 tCO2e (2024), marked Limited
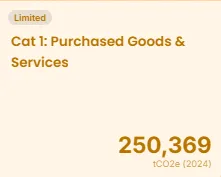
DitchCarbon platform card showing Cat 1: Purchased Goods & Services: 250,369 tCO2e (2024), marked Limited
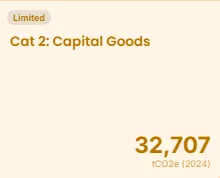
DitchCarbon platform card showing Cat 2: Capital Goods: 32,707 tCO2e (2024), marked Limited
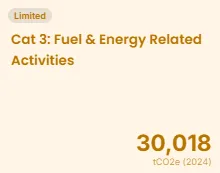
DitchCarbon platform card showing Cat 3: Fuel & Energy Related Activities: 30,018 tCO2e (2024), marked Limited
DitchCarbon platform card showing Cat 6: Business Travel: 240,963 tCO2e (2024), marked Limited
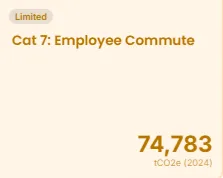
DitchCarbon platform card showing Cat 7: Employee Commute: 74,783 tCO2e (2024), marked Limited
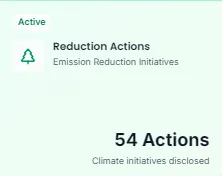
DitchCarbon platform card showing Reduction Actions: 54 actions, climate initiatives disclosed, marked Active
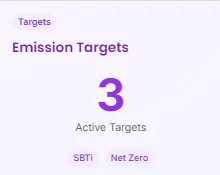
DitchCarbon platform card showing Emission Targets: 3 active targets, tagged SBTi and Net Zero
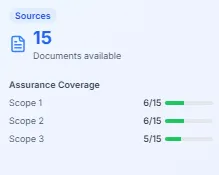
DitchCarbon platform card showing Sources: 15 documents available, with assurance coverage of 6/15 for Scope 1, 6/15 for Scope 2 and 5/15 for Scope 3
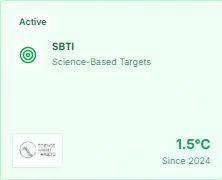
DitchCarbon platform card showing an active SBTi science-based target of 1.5°C since 2024
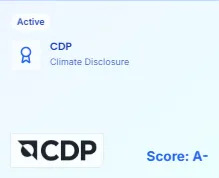
DitchCarbon platform card showing active CDP climate disclosure with a score of A-
DitchCarbon platform card showing active RE100 renewable energy commitment, target 2023, since 2019
DitchCarbon platform card showing active Race to Zero commitment with a 2030 date
DitchCarbon platform card showing active membership of The Climate Pledge, net zero by 2040
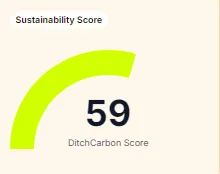
DitchCarbon platform card showing a Sustainability Score gauge with a DitchCarbon score of 59
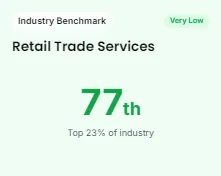
DitchCarbon platform card showing an Industry Benchmark for Retail Trade Services: 77th, top 23% of industry, rated Very Low
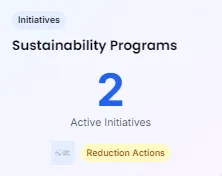
DitchCarbon platform card showing Sustainability Programs: 2 active initiatives, including Reduction Actions
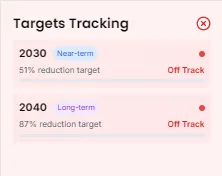
DitchCarbon platform card showing Targets Tracking: 2030 near-term 51% reduction target and 2040 long-term 87% reduction target, both off track
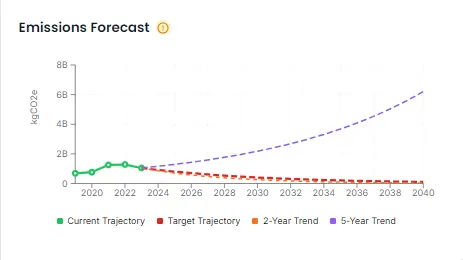
DitchCarbon platform Emissions Forecast chart from 2020 to 2040, comparing current trajectory, target trajectory, 2-year and 5-year trends
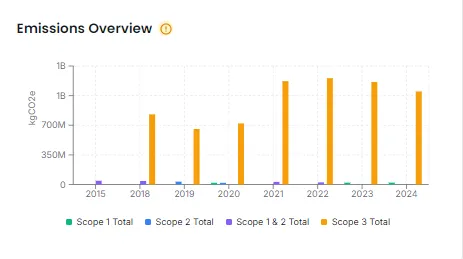
DitchCarbon platform Emissions Overview bar chart of Scope 1, Scope 2 and Scope 3 totals from 2015 to 2024, dominated by Scope 3
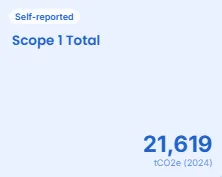
DitchCarbon platform card showing Scope 1 Total: 21,619 tCO2e (2024), marked Self-reported
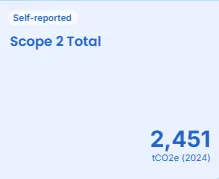
DitchCarbon platform card showing Scope 2 Total: 2,451 tCO2e (2024), marked Self-reported
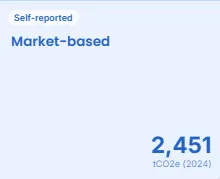
DitchCarbon platform card showing Market-based: 2,451 tCO2e (2024), marked Self-reported
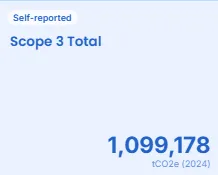
DitchCarbon platform card showing Scope 3 Total: 1,099,178 tCO2e (2024), marked Self-reported
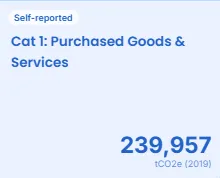
DitchCarbon platform card showing Cat 1: Purchased Goods & Services: 239,957 tCO2e (2019), marked Self-reported
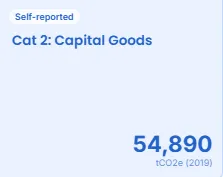
DitchCarbon platform card showing Cat 2: Capital Goods: 54,890 tCO2e (2019), marked Self-reported
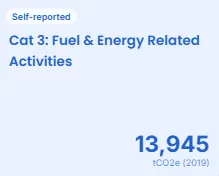
DitchCarbon platform card showing Cat 3: Fuel & Energy Related Activities: 13,945 tCO2e (2019), marked Self-reported
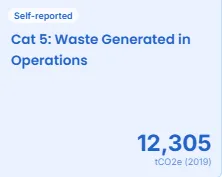
DitchCarbon platform card showing Cat 5: Waste Generated in Operations: 12,305 tCO2e (2019), marked Self-reported
DitchCarbon platform card showing Cat 6: Business Travel: 55,711 tCO2e (2019), marked Self-reported
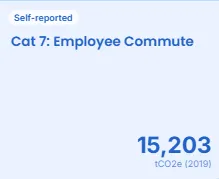
DitchCarbon platform card showing Cat 7: Employee Commute: 15,203 tCO2e (2019), marked Self-reported
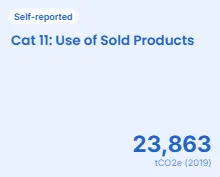
DitchCarbon platform card showing Cat 11: Use of Sold Products: 23,863 tCO2e (2019), marked Self-reported
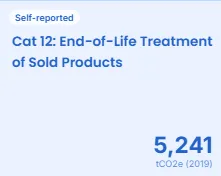
DitchCarbon platform card showing Cat 12: End-of-Life Treatment of Sold Products: 5,241 tCO2e (2019), marked Self-reported
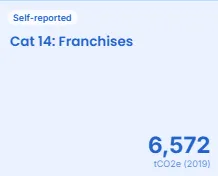
DitchCarbon platform card showing Cat 14: Franchises: 6,572 tCO2e (2019), marked Self-reported
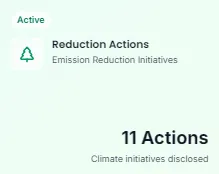
DitchCarbon platform card showing Reduction Actions: 11 actions, climate initiatives disclosed, marked Active
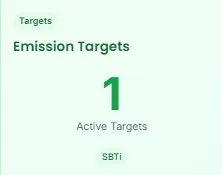
DitchCarbon platform card showing Emission Targets: 1 active target, tagged SBTi
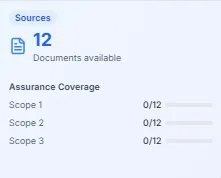
DitchCarbon platform card showing Sources: 12 documents available, with 0/12 assurance coverage for Scopes 1, 2 and 3
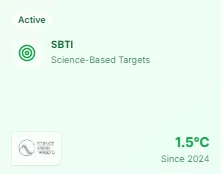
DitchCarbon platform card showing an active SBTi science-based target of 1.5°C since 2024
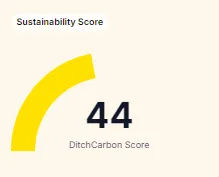
DitchCarbon platform card showing a Sustainability Score gauge with a DitchCarbon score of 44
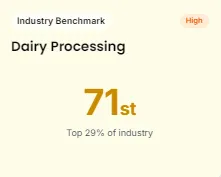
DitchCarbon platform card showing an Industry Benchmark for Dairy Processing: 71st, top 29% of industry, rated High
DitchCarbon platform card showing Sustainability Programs: 2 active initiatives, including Reduction Actions
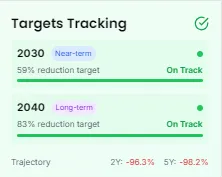
DitchCarbon platform card showing Targets Tracking: 2030 near-term 59% reduction target and 2040 long-term 83% reduction target, both on track
DitchCarbon platform Emissions Forecast chart from 2020 to 2040, comparing current trajectory, target trajectory, 2-year and 5-year trends
DitchCarbon platform Emissions Overview bar chart of Scope 1, Scope 2 and Scope 3 totals from 2015 to 2024, dominated by Scope 3
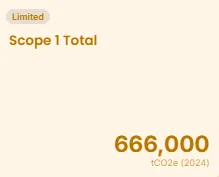
DitchCarbon platform card showing Scope 1 Total: 666,000 tCO2e (2024), marked Limited
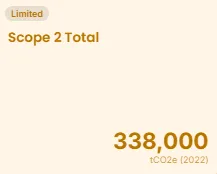
DitchCarbon platform card showing Scope 2 Total: 338,000 tCO2e (2022), marked Limited
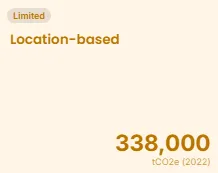
DitchCarbon platform card showing Location-based: 338,000 tCO2e (2022), marked Limited
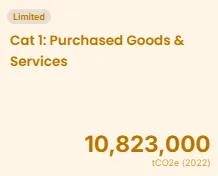
DitchCarbon platform screen showing a "Cat 1: Purchased Goods & Services" card, marked Limited, of 10,823,000 tCO2e (2022)
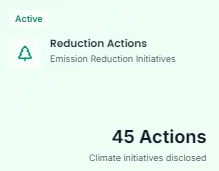
DitchCarbon platform screen showing an active "Reduction Actions" card with 45 climate initiatives disclosed
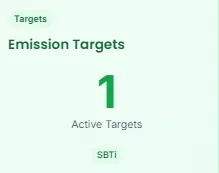
DitchCarbon platform screen showing an "Emission Targets" card with 1 active SBTi target
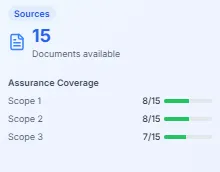
DitchCarbon platform screen showing a Sources card with 15 documents and assurance coverage of 8/15, 8/15 and 7/15 for Scopes 1 to 3
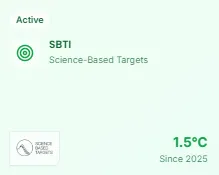
DitchCarbon platform screen showing an active SBTi Science-Based Targets card with a 1.5°C target since 2025
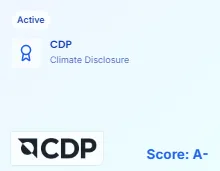
DitchCarbon platform screen showing an active CDP Climate Disclosure card with a score of A-
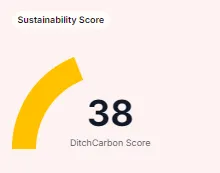
DitchCarbon platform screen showing a Sustainability Score gauge reading a DitchCarbon Score of 38
DitchCarbon platform card showing an Industry Benchmark for Retail Trade Services: 77th, top 23% of industry, rated Very Low
DitchCarbon platform card showing Sustainability Programs: 2 active initiatives, including Reduction Actions
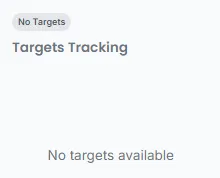
DitchCarbon platform screen showing a "Targets Tracking" card reading "No targets available"
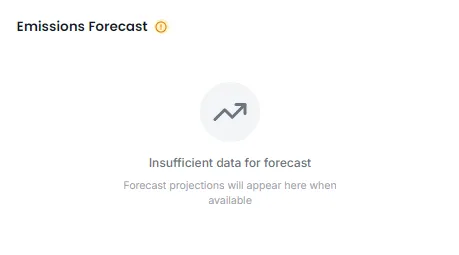
DitchCarbon platform screen showing an "Emissions Forecast" panel reading "Insufficient data for forecast"
DitchCarbon platform Emissions Overview bar chart of Scope 1, Scope 2 and Scope 3 totals from 2015 to 2024, dominated by Scope 3
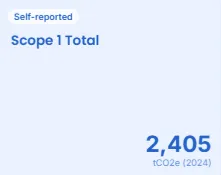
DitchCarbon platform screen showing a self-reported "Scope 1 Total" card of 2,405 tCO2e (2024)
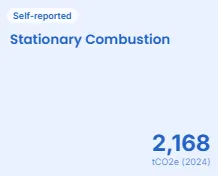
DitchCarbon platform screen showing a self-reported "Stationary Combustion" card of 2,168 tCO2e (2024)
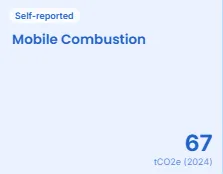
DitchCarbon platform screen showing a self-reported "Mobile Combustion" card of 67 tCO2e (2024)
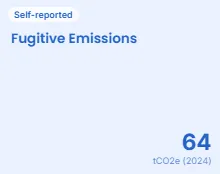
DitchCarbon platform screen showing a self-reported "Fugitive Emissions" card of 64 tCO2e (2024)
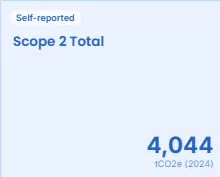
DitchCarbon platform screen showing a self-reported "Scope 2 Total" card of 4,044 tCO2e (2024)
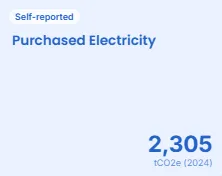
DitchCarbon platform screen showing a self-reported "Purchased Electricity" card of 2,305 tCO2e (2024)
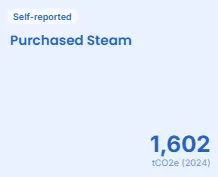
DitchCarbon platform screen showing a self-reported "Purchased Steam" card of 1,602 tCO2e (2024)
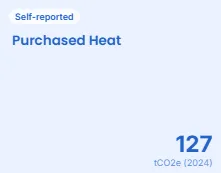
DitchCarbon platform screen showing a self-reported "Purchased Heat" card of 127 tCO2e (2024)
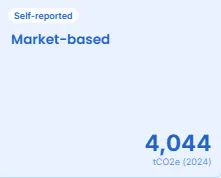
DitchCarbon platform screen showing a self-reported "Market-based" card of 4,044 tCO2e (2024)
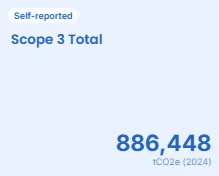
DitchCarbon platform screen showing a self-reported "Scope 3 Total" card of 886,448 tCO2e (2024)
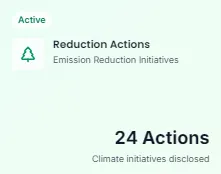
DitchCarbon platform screen showing an active "Reduction Actions" card with 24 climate initiatives disclosed
DitchCarbon platform card showing Emission Targets: 1 active target, tagged SBTi
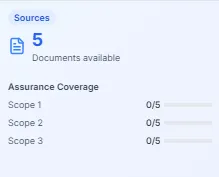
DitchCarbon platform screen showing a Sources card with 5 documents and assurance coverage of 0/5 for Scopes 1 to 3
DitchCarbon platform card showing Emission Targets: 1 active target, tagged SBTi
DitchCarbon platform screen showing a Sustainability Score gauge reading a DitchCarbon Score of 38
DitchCarbon platform card showing an Industry Benchmark for Retail Trade Services: 77th, top 23% of industry, rated Very Low
DitchCarbon platform card showing Sustainability Programs: 2 active initiatives, including Reduction Actions
DitchCarbon platform screen showing a "Targets Tracking" card reading "No targets available"
DitchCarbon platform screen showing an "Emissions Forecast" panel reading "Insufficient data for forecast"
DitchCarbon platform Emissions Overview bar chart of Scope 1, Scope 2 and Scope 3 totals from 2015 to 2024, dominated by Scope 3
DitchCarbon platform screen showing a self-reported "Scope 1 Total" card of 2,405 tCO2e (2024)
DitchCarbon platform screen showing a self-reported "Stationary Combustion" card of 2,168 tCO2e (2024)
DitchCarbon platform screen showing a self-reported "Mobile Combustion" card of 67 tCO2e (2024)
DitchCarbon platform screen showing a self-reported "Fugitive Emissions" card of 64 tCO2e (2024)
DitchCarbon platform screen showing a self-reported "Scope 2 Total" card of 4,044 tCO2e (2024)
DitchCarbon platform screen showing a self-reported "Purchased Electricity" card of 2,305 tCO2e (2024)
DitchCarbon platform screen showing a self-reported "Purchased Steam" card of 1,602 tCO2e (2024)
DitchCarbon platform screen showing a self-reported "Purchased Heat" card of 127 tCO2e (2024)
DitchCarbon platform screen showing a self-reported "Market-based" card of 4,044 tCO2e (2024)
DitchCarbon platform screen showing a self-reported "Scope 3 Total" card of 886,448 tCO2e (2024)
DitchCarbon platform screen showing an active "Reduction Actions" card with 24 climate initiatives disclosed
DitchCarbon platform card showing Emission Targets: 1 active target, tagged SBTi
DitchCarbon platform screen showing a Sources card with 5 documents and assurance coverage of 0/5 for Scopes 1 to 3
DitchCarbon platform card showing Emission Targets: 1 active target, tagged SBTi

How is the data verified?

The calculator is verified to ISO 14064-3, limited assurance, by UL Solutions, renewed annually. Every figure carries its source, and the documents are open for download in the trust centre.
Calculator verified to ISO 14064-3, limited assurance
Open the trust centre

Before you send the form

Get answers to the questions procurement and sustainability teams ask most often.

What happens after I send the form?
Do you cover private companies?
How much does it cost?
Been asked for your own emissions data?

See the coverage on your own list