
Supplier electricity map
DitchCarbon's Energy Map shows how much electricity sits behind an enterprise's purchases, by organisation and country, with each country coloured by how low-carbon its grid is.
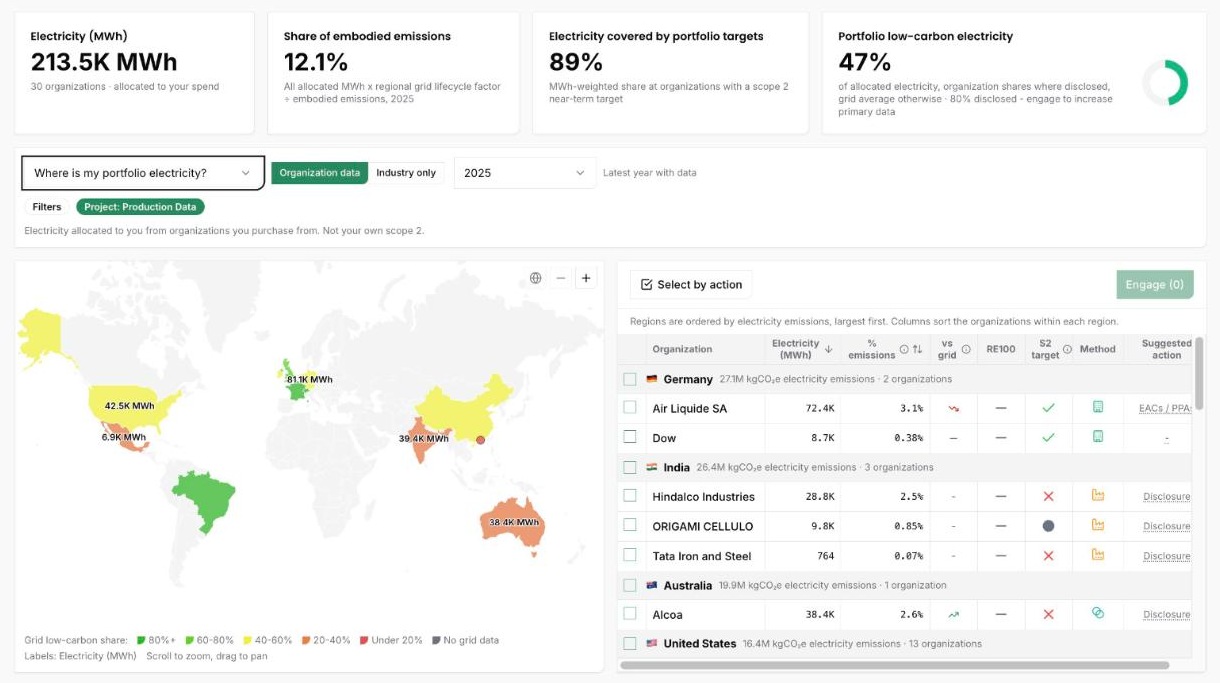
The Energy Map allocates each organisation's electricity to your spend with it and plots the total by country. Every country is coloured by the low-carbon share of its grid, and the regions are ranked by electricity emissions, so the megawatt hours that carry the most carbon are the first thing you see.
Electricity is the part of a supplier's footprint with a known route down: the supplier can buy low-carbon power, and the market for it already exists. Acting on that across global supply chains takes a view most Scope 3 programmes do not have: how much electricity is behind your purchases, and which grids it is drawn from.
The map answers that for one project at a time. Four tiles sit above it: the electricity allocated to your spend in megawatt hours, the share of your embodied emissions that electricity represents, the share of it sitting with organisations that hold a near-term Scope 2 target, and the low-carbon share of the whole portfolio. The figures are the electricity of the organisations you buy from, allocated to you. Your own Scope 2 stays out of it, and spend with electricity sellers is excluded for the same reason.
Beside the map, a table groups organisations by country, largest electricity emissions first. Each row carries its megawatt hours, its share of your emissions, its position against the local grid, RE100 membership, Scope 2 target status, the method behind the figure and a suggested action. Open a row for the detail and the source document.
Three preset questions change what the map counts: all portfolio electricity, the part of it that is not yet low-carbon, and the part to plan energy attribute certificates or PPAs for. Filter by industry or region, and step back through reporting years to 2019.
Common questions

See the electricity behind your purchases
Numbers you can defend within 2 weeks, or one profile that answers every buyer asking.


 Peer Insights
 by Scope 3 Peer Group
Ditch Carbon Ltd
167-169 Great Portland Street
London W1W 5PF
