.svg)
SBTi progress tracking
DitchCarbon tracks how much of a portfolio has committed to or set science-based targets over time, weighted by emissions, spend or number of organisations.
The chart plots SBTi status across your portfolio year by year. Filter by status, from committed through near-term and long-term targets to net-zero, and choose whether to weight the result by share of embodied emissions, share of spend, or share of organisations.
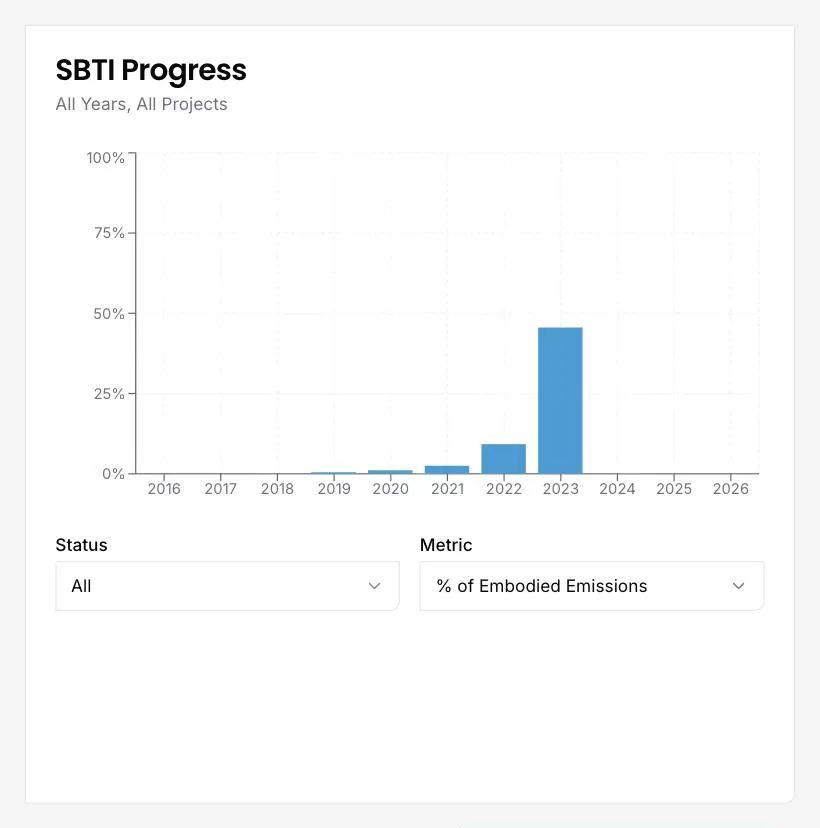
The weighting choice is the part that changes the answer. Weighted by count, a portfolio can look poor while the organisations carrying most of the footprint are all committed. Weighted by embodied emissions, the same portfolio looks strong.
Both are true, and they answer different questions: one is how far the programme has spread, the other is whether it has reached the organisations that matter.
Supplier engagement targets increasingly get written in the emissions-weighted form, because that is the version that moves a footprint. Tracking both means the target and the report can use the same figure.
The SBTi dataset behind this is snapshotted weekly, so status changes appear within days of publication rather than at the next annual review.
Common questions

See it on your own suppliers, portfolio or profile
Numbers you can defend within 2 weeks, or one profile that answers every buyer asking.


